- Consistent income — predictable distributions thanks to fee-based revenue.
- Inflation hedge — contracts often include inflation-linked tariff escalators.
- Growth potential — pipeline expansions open new revenue streams.
EPD vs ET Stock – Comparative Analysis of High-Yield Midstream Investments

In the bustling world of energy infrastructure, EPD vs ET stock comparisons have become a favorite among income-focused investors. Midstream energy stocks like Enterprise Products Partners and Energy Transfer are known for their stable cash flows and robust dividends, making them excellent candidates for diversification. If you want to trade exposure to top energy infrastructure companies with just $5 and even practice on a free demo account, Pocket Option offers 100+ OTC assets including major energy stocks 24/7.
Article navigation
- Introduction to Midstream Stocks
- What are Midstream Stocks?
- Why High-Yield Midstream Stocks Matter
- Overview of EPD and ET
- Company Profiles
- Extended Financial Analysis and Analyst Forecasts
- Risk Comparison Table
- Investment Considerations
- Pocket Option — Your Gateway to Energy Stock Trading
- Final Thoughts
Introduction to Midstream Stocks
The midstream sector plays a pivotal role in transporting and storing vital resources such as crude oil and natural gas through extensive pipeline transportation systems. These companies form the logistics backbone of the energy industry, operating pipeline capacity networks that move resources from production to refining and distribution. Many are structured as MLP investment vehicles, formally known as master limited partnership structures, which combine the liquidity of publicly traded partnerships with pass-through taxation. This means most profits are distributed directly to unitholders, avoiding corporate income tax and resulting in higher effective yields.
Expert Insight — JPMorgan: “Midstream MLPs remain one of the most compelling sources of income in the energy sector, with yields that consistently outperform utilities and REITs.”
Midstream stocks remain popular because they typically operate on fee-based contracts, insulating them from commodity price swings and offering investors steady income. 📈 This makes them a core building block for any energy sector investment strategy.
What are Midstream Stocks?
Midstream companies manage transportation, storage, and processing of energy resources. This makes them crucial in global energy infrastructure. They generate cash flows that are relatively stable even during market volatility. For investors, this means reliable dividends, often beating the average dividend yield comparison with other sectors.
Why High-Yield Midstream Stocks Matter
Morgan Stanley Research: “Fee-based midstream models offer a defensive play against commodity price swings, making them ideal for long-term income portfolios.”
Examples of top midstream players include Enterprise Products Partners (EPD) and Energy Transfer (ET), which analysts frequently recommend for income portfolios.
Overview of EPD and ET
Both EPD and ET dominate the midstream landscape and are widely featured in pipeline stocks comparison reports.

| EPD vs ET Stock Overview | ||||||
|---|---|---|---|---|---|---|
| Company | Ticker | Market Cap | Dividend Yield | Debt/EBITDA | ROE | Key Strength |
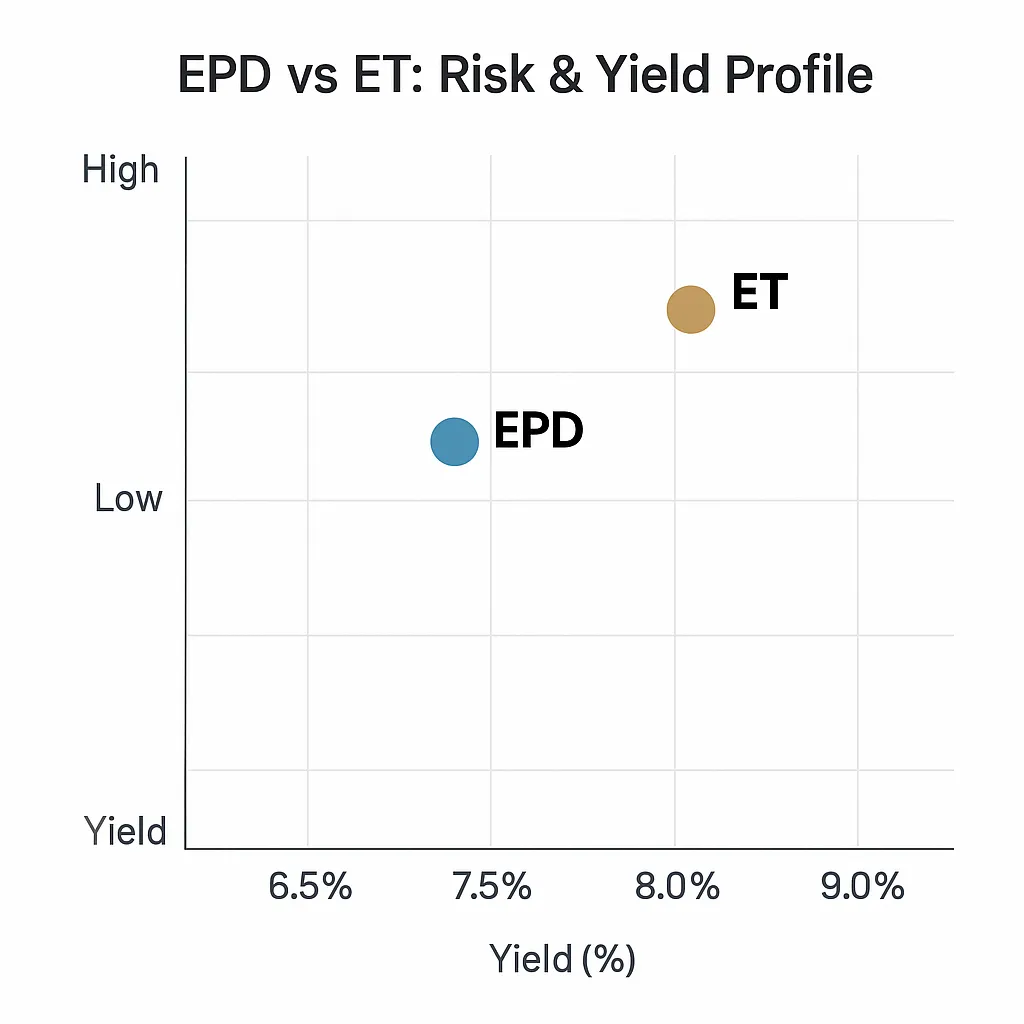
| Enterprise Products Partners | EPD | ~$60B | ~7.2% | 3.0x | 19% | Strong balance sheet, conservative leverage |
| Energy Transfer | ET | ~$50B | ~8.5% | 3.8x | 21% | Aggressive growth, largest natural gas pipeline network |
Company Profiles
Enterprise Products Partners (EPD)
EPD operates one of the most extensive pipeline and storage networks in North America, moving crude oil, NGLs, and natural gas through thousands of miles of crude oil pipelines and fractionation facilities. Its focus on conservative leverage allows it to maintain one of the strongest credit profiles in the sector. Investors appreciate its steady distribution growth for over 20 consecutive years.
- Over 50,000 miles of pipelines.
- Industry-leading distribution coverage ratio >1.7x.
- Over $4B in annual growth projects focused on natural gas liquids and petrochemical infrastructure.
- Five-year average return on invested capital (ROIC): 12%.
Energy Transfer (ET)
ET is a powerhouse with over 125,000 miles of pipeline capacity, making it one of the largest MLPs globally. Its system represents a crucial part of U.S. natural gas infrastructure, with major export capacity for LNG and NGLs.
- Leading exporter of LNG and NGLs.
- Attractive valuation with high dividend yield comparison vs peers.
- Large-scale expansion projects targeting Permian Basin takeaway capacity.
- Five-year average ROIC: 13.5%.
Extended Financial Analysis and Analyst Forecasts
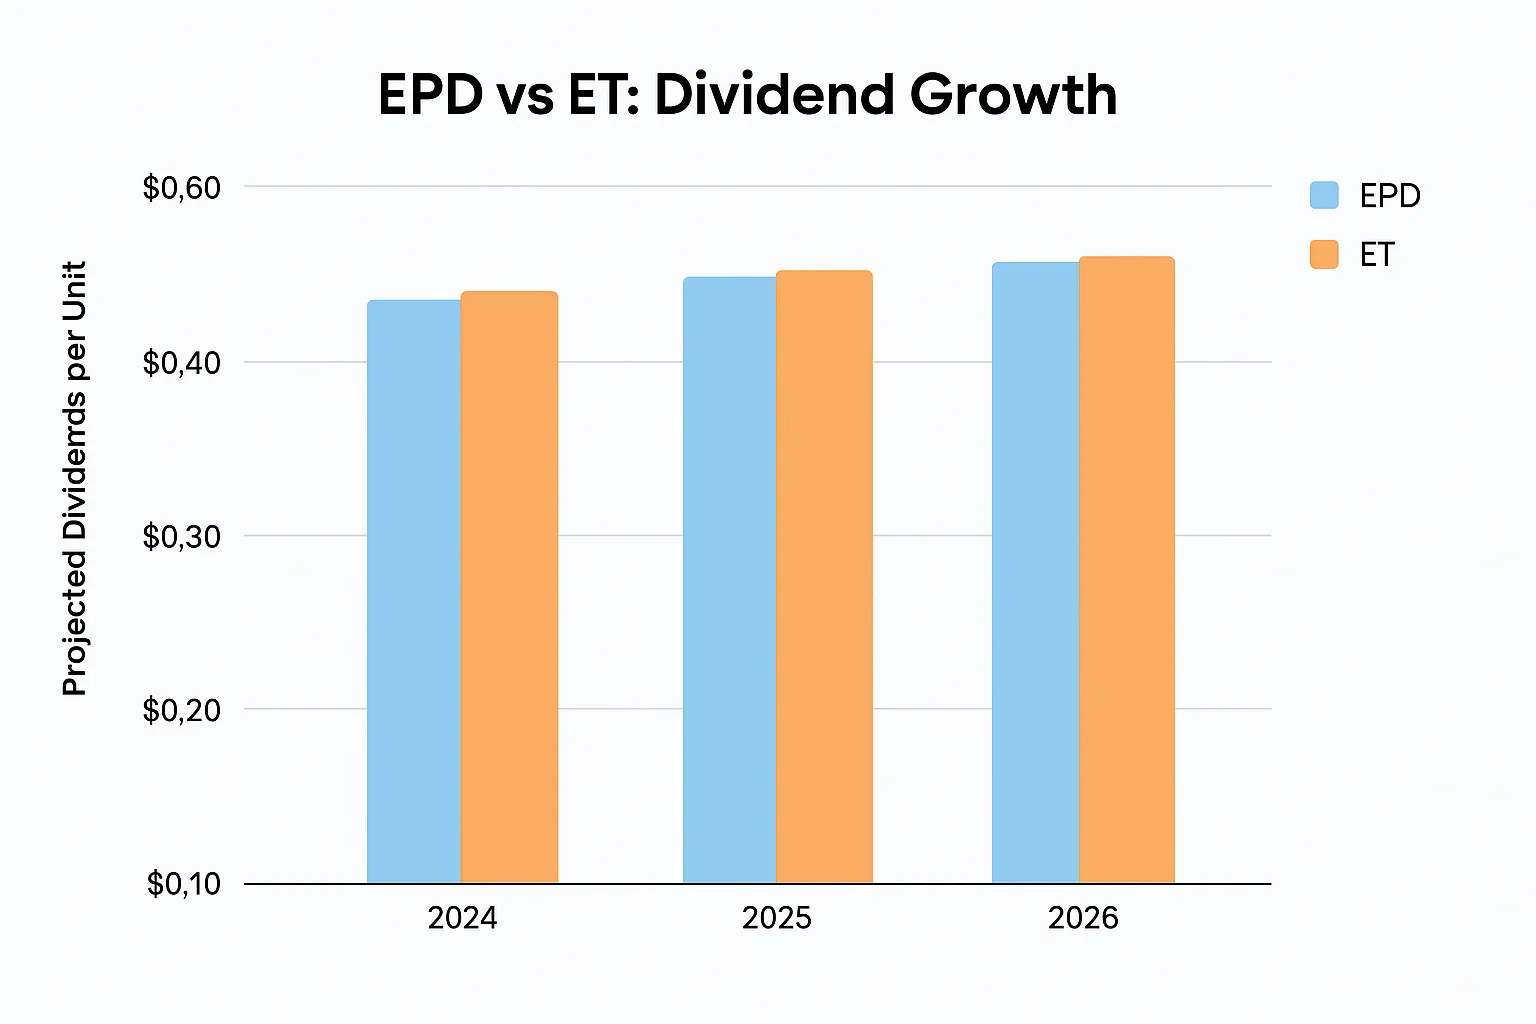
Analysts project both EPD and ET to see distributable cash flow growth of 3–5% annually through 2026, driven by new projects and higher volumes.

| EPD vs ET: Dividend Growth (2024–2026) | ||
|---|---|---|
| Year | EPD DCF Forecast | ET DCF Forecast |
| 2024 | $8.3B (+3%) | $12.4B (+4%) |
| 2025 | $8.6B (+3.5%) | $12.9B (+4%) |
| 2026 | $9.0B (+4%) | $13.4B (+4%) |
UBS Midstream Outlook: “Both EPD and ET are well positioned to raise distributions above inflation through 2026, supported by fee-based cash flows and capacity expansions.”
Risk Comparison Table
| Risk Factor | EPD | ET |
|---|---|---|
| Leverage Risk | Low — conservative debt policy | Moderate — still reducing leverage |
| Commodity Price Sensitivity | Low — >80% fee-based | Low — similar contract structure |
| Regulatory Risk | Medium (pipeline approvals) | Medium/High (larger project exposure) |
| Distribution Sustainability | High — 20+ yrs growth | Improving — restored post-2020 cut |
| Execution Risk | Low | Moderate (due to aggressive growth strategy) |

Insider Perspective: Portfolio managers often note that holding both EPD and ET balances safety and yield, creating a natural hedge in income portfolios.
Investment Considerations
Including midstream equities like EPD and ET can diversify an energy sector investment portfolio. Both provide exposure to pipeline assets, natural gas processing, and pipeline transportation infrastructure critical for North America.
Pocket Option — Your Gateway to Energy Stock Trading
Pocket Option allows traders to forecast price movements of energy companies like EPD and ET without owning the shares. ✅ You can trade with as little as $5*, use a free demo account to practice, and access features like:
- AI Trading to automate strategies 🤖
- Telegram Signal Bot for instant setups
- Social Trading to copy successful traders
- Tournaments to compete and win prizes 🏆
*minimum deposit may vary depending on geo and payment method
Final Thoughts
Comparing EPD vs ET stock reveals two robust midstream energy players with strong fundamentals, attractive yields, and long-term growth potential. Enterprise Products Partners stands out for its conservative balance sheet and steady growth, while Energy Transfer offers a higher yield and more aggressive expansion. For investors seeking exposure to midstream energy stocks, holding both can provide a balanced mix of stability and income while strengthening a broader energy sector investment strategy.
Final Expert Insight: “Midstream equities may remain one of the most undervalued corners of the energy sector in 2025, offering a rare combination of income and growth.” — Goldman Sachs Energy Research
Whether you are a seasoned income investor or just starting, Pocket Option provides a flexible way to speculate on these pipeline stocks comparison opportunities, anytime, anywhere. 📱
FAQ
Which is better EPD or ET stock?
EPD is generally considered safer due to its conservative leverage and 20+ years of distribution growth, while ET offers a slightly higher yield and more aggressive growth potential. Many analysts recommend holding both for diversification.
What are the differences between EPD and ET?
EPD has a stronger credit rating, lower leverage, and a focus on petrochemical infrastructure. ET operates the largest natural gas pipeline network in the U.S. and is more growth-oriented.
How do EPD and ET dividends compare?
EPD has a longer track record of consistent dividend increases, while ET cut its dividend in 2020 but has since fully restored it and continues to grow distributions faster
Which pipeline stock is safer for investment?
EPD is often viewed as the safer, lower-risk option due to its conservative balance sheet. ET carries slightly more leverage but compensates investors with a higher yield.
What is the long-term outlook for midstream energy stocks (2025–2030)?
Analysts project steady demand for natural gas and NGLs, supporting continued growth in pipeline capacity and cash flows. Both EPD and ET are expected to maintain competitive dividend yields and expand infrastructure, making them attractive for long-term income investors.
