- Win Rate: (Winning Trades / Total Trades) × 100%. Assesses overall signal accuracy.
- Risk-Reward Ratio: Potential Profit / Potential Loss. Helps in planning position sizes.
- Signal Strength: A weighted combination of indicators. Used for deciding entry points.
Binary Options Trading Signals: A Mathematical Approach

Binary options trading signals guide data-driven decisions. Learn how they’re generated, analyzed, and optimized.
Article navigation
Overview of Mathematical Analysis
The mathematical analysis of binary options trading signals represents a structured and logic-driven approach to market behavior. By combining statistical models with probability theory, traders can identify more reliable indicators and reduce guesswork. These methods provide a framework for data interpretation and help build consistency in binary trading decisions.
Key Mathematical Components
Accurate signals rely on measurable components. Below are some of the most relevant metrics used in evaluating signal quality:
These metrics allow traders to quantify how effective a signal truly is — and adjust their approach accordingly.
Statistical Analysis Methods
Several technical tools serve as the foundation for building and analyzing binary option trading signals:
- Moving Average Convergence Divergence (MACD)
- Relative Strength Index (RSI)
- Bollinger Bands Deviation
- Standard Deviation and Volatility Metrics
Longer timeframes tend to deliver more consistent results. For example:
- 1-Hour Signals: 76% accuracy (sample size: 1000)
- 4-Hour Signals: 82% accuracy (sample size: 500)
- Daily Signals: 88% accuracy (sample size: 250)
Choosing the right timeframe can significantly impact the success rate of binary trading signals.
Signal Generation Process
Binary options trading signals are generated through algorithmic models that combine real-time data, technical indicators, and historical patterns.
Typical input elements:
- Price Action Recognition
- Volume and Volatility Indicators
- Market Sentiment Metrics
- Cross-Timeframe Pattern Detection
Each component is assigned a reliability weight. For example:
- Technical: 40% weight, 0.85 reliability
- Statistical: 35% weight, 0.82 reliability
- Fundamental: 25% weight, 0.78 reliability
By blending these, traders can improve both timing and precision of their entries.
Performance Metrics in Signal Evaluation
Ongoing measurement ensures that binary trading signals remain relevant. Below are performance metrics commonly used:
- Signal Latency: Target < 0.5s. Actual: 0.3s
- False Signal Rate: Target < 15%. Actual: 12%
- Success Rate: Target > 75%. Actual: 79%
These data points allow traders to identify inefficiencies and improve future signal filters.
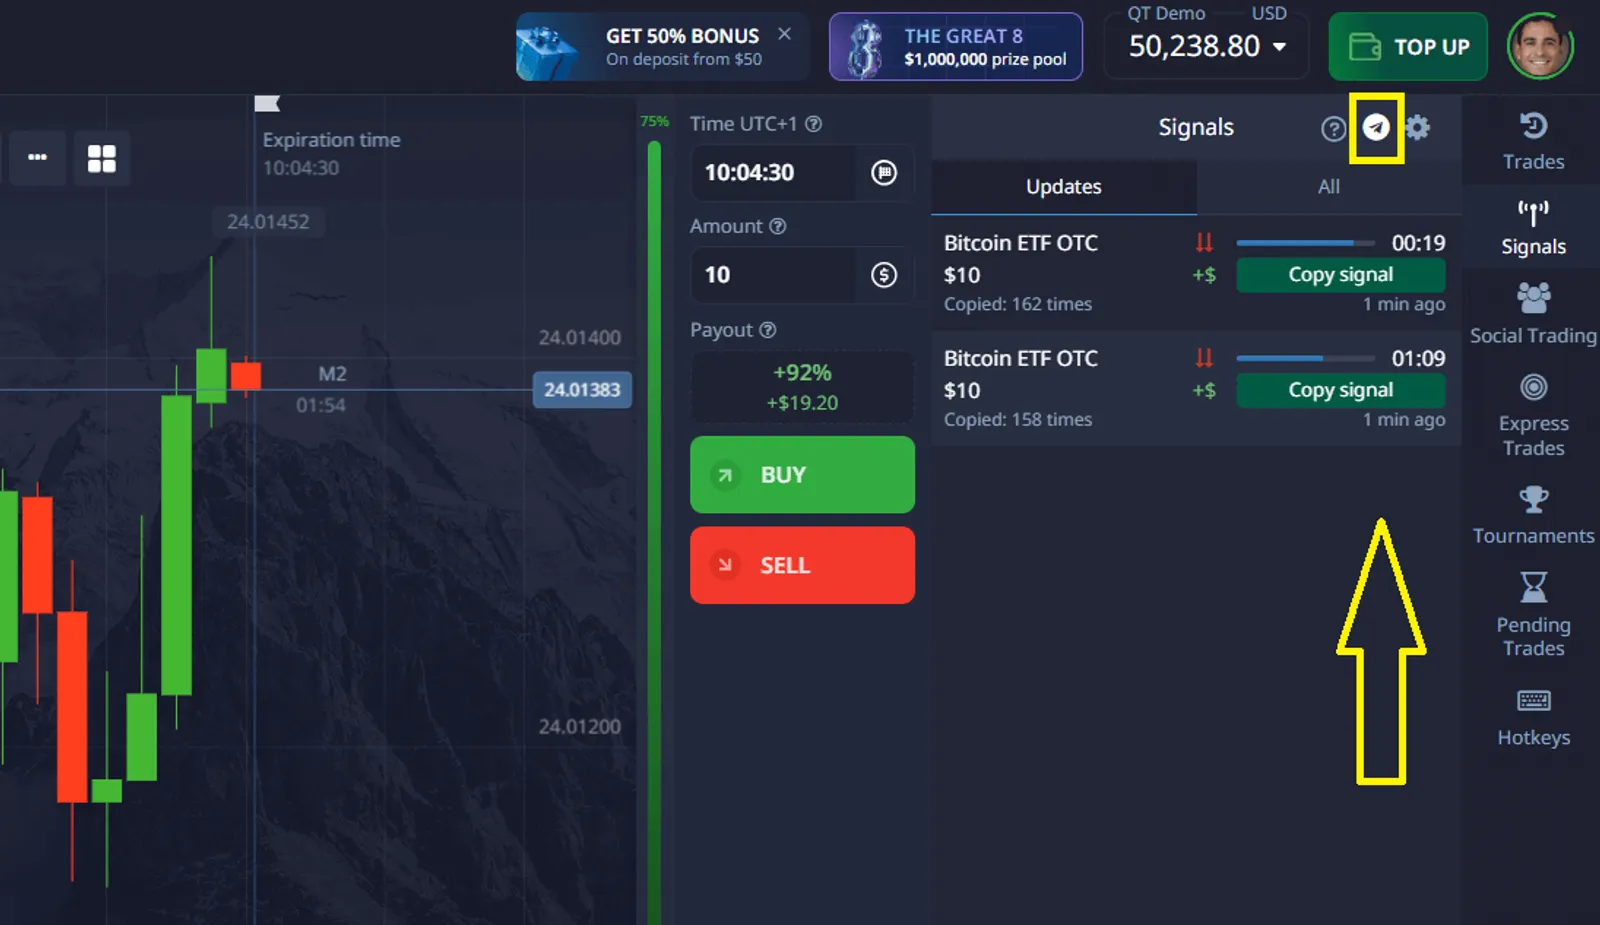
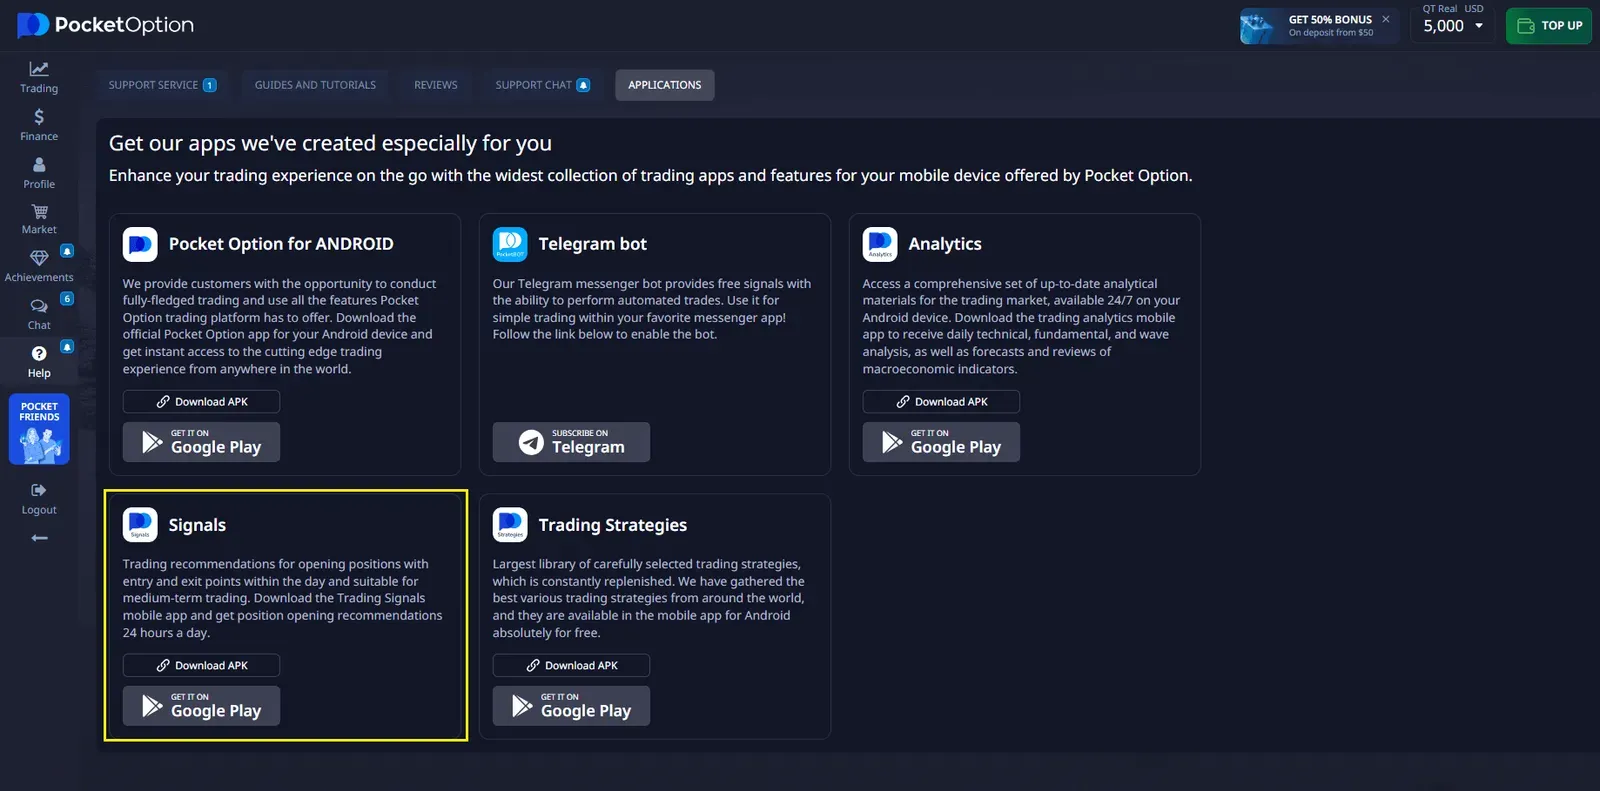
How Pocket Option Delivers Trading Signals
Pocket Option provides traders with two powerful types of trading signals for fast market decisions:
1. Telegram Bot Signals
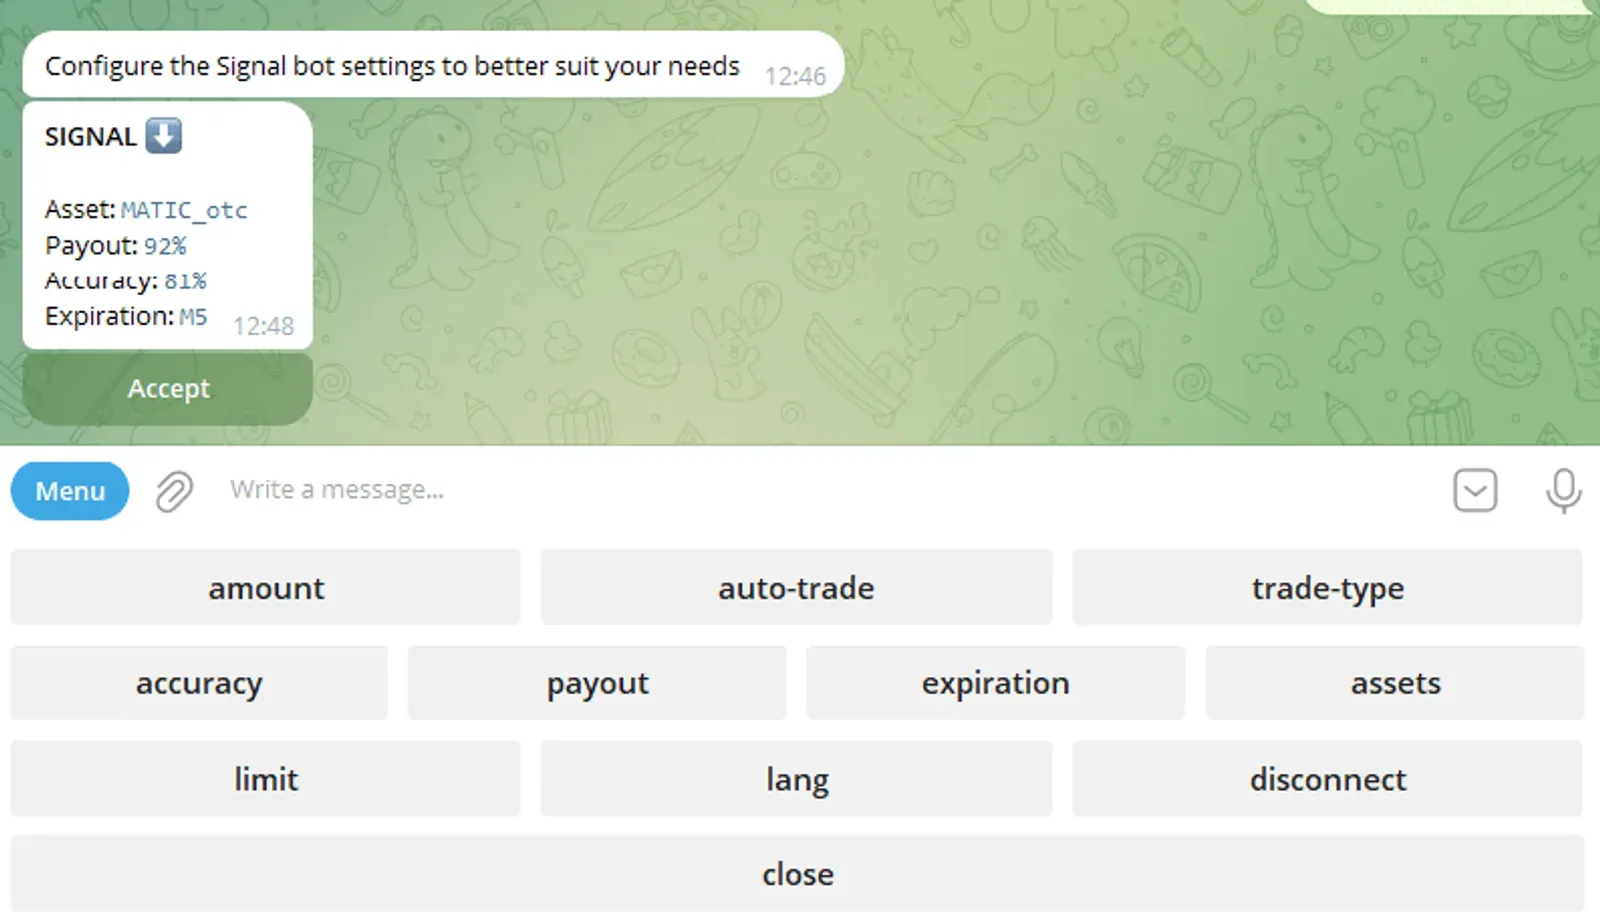
- Delivered directly to your Telegram account
- Provide real-time market direction (up/down)
- Cover multiple assets: forex, crypto, stocks, commodities
- Customizable alerts for mobile or desktop
These signals are ideal for staying updated even when you’re not actively on the platform.
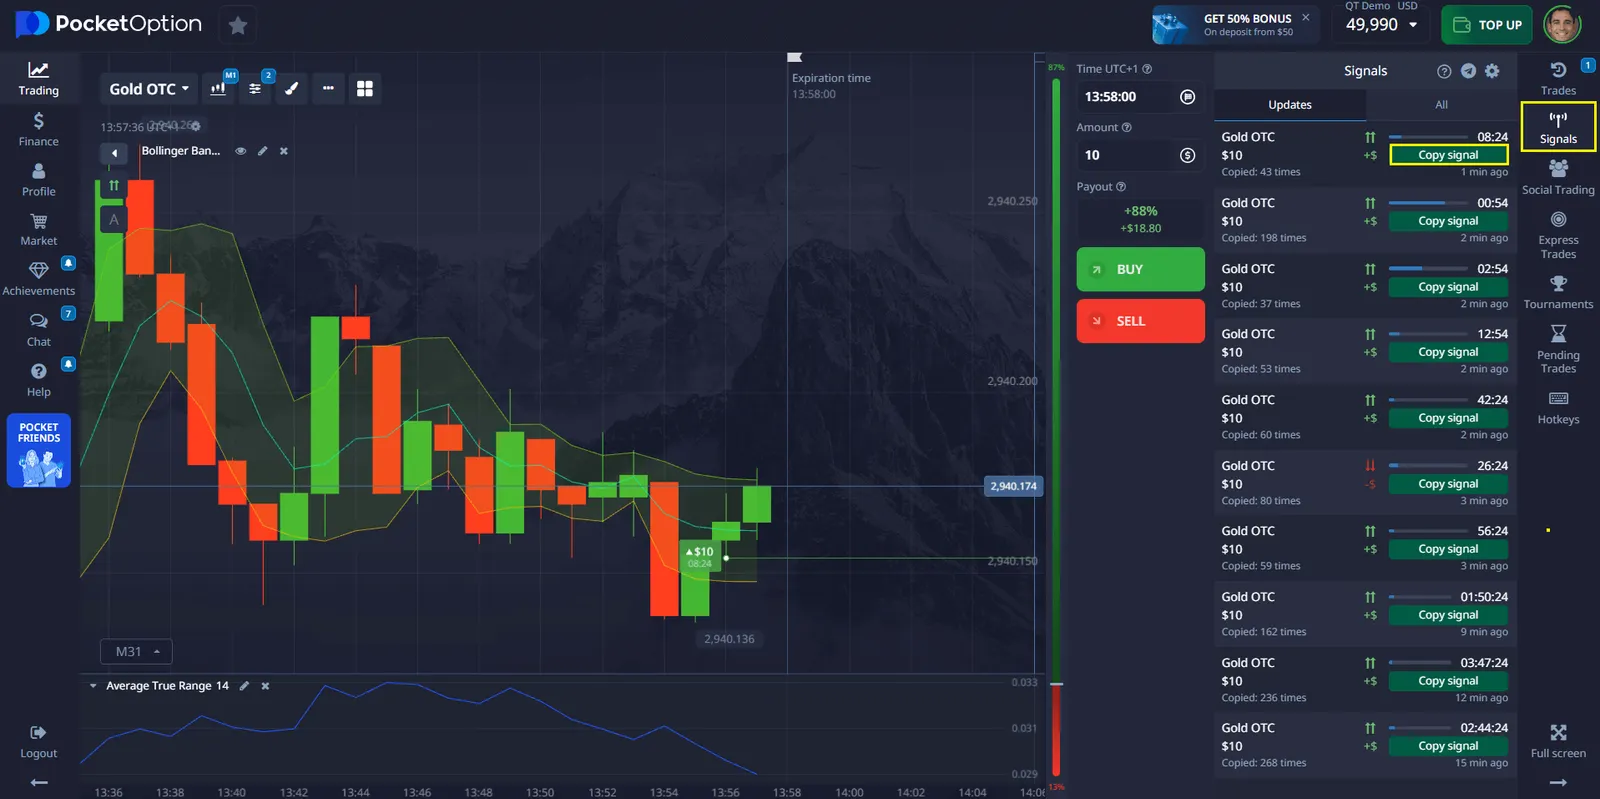
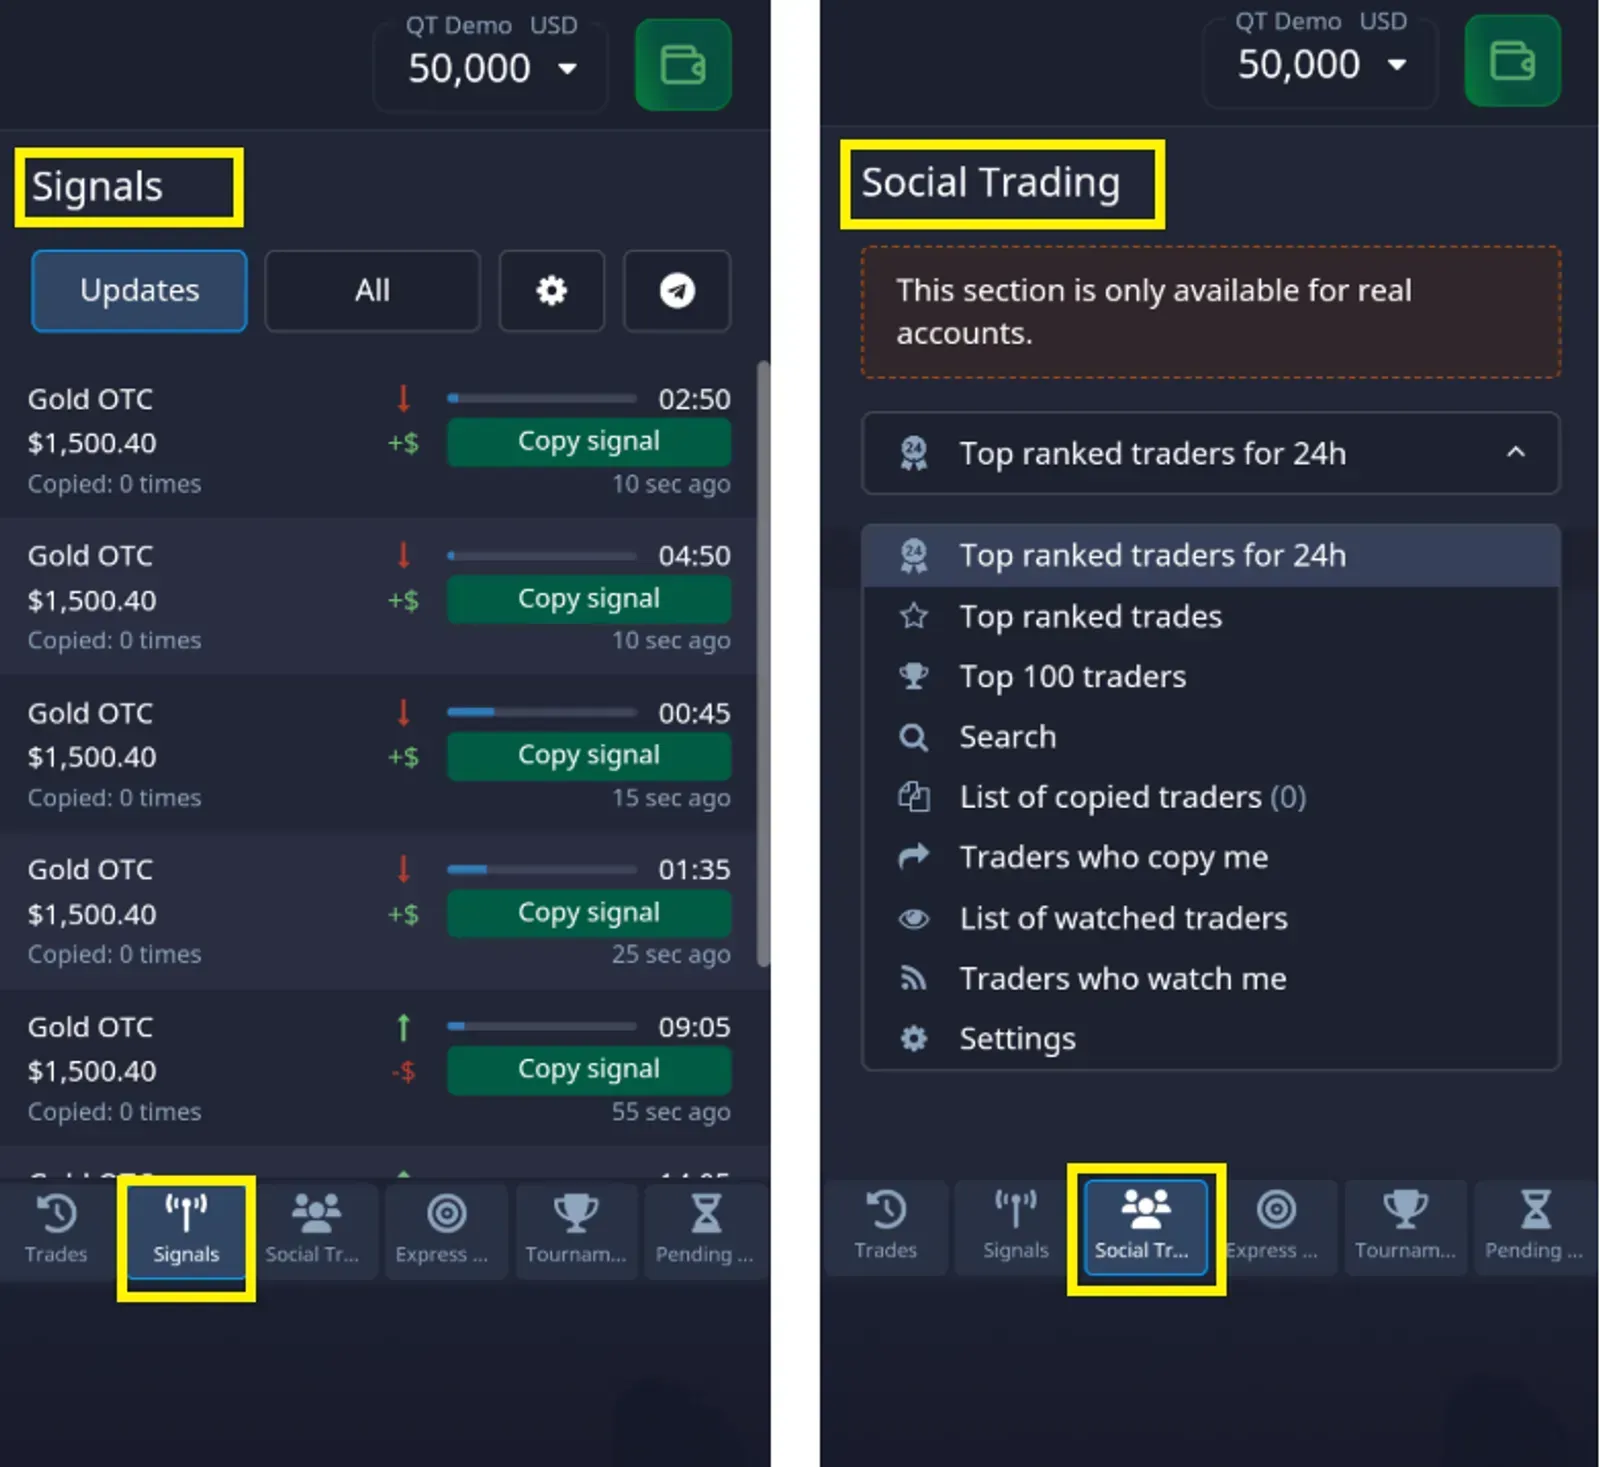
2. Platform-Based Signals
- Integrated directly into the Pocket Option interface
- Shown live during trading sessions
- Based on selected purchase times (e.g., S5 to H4)
- Displayed using trend arrows:
- One arrow = general trend
- Two arrows = strong signal for higher confidence
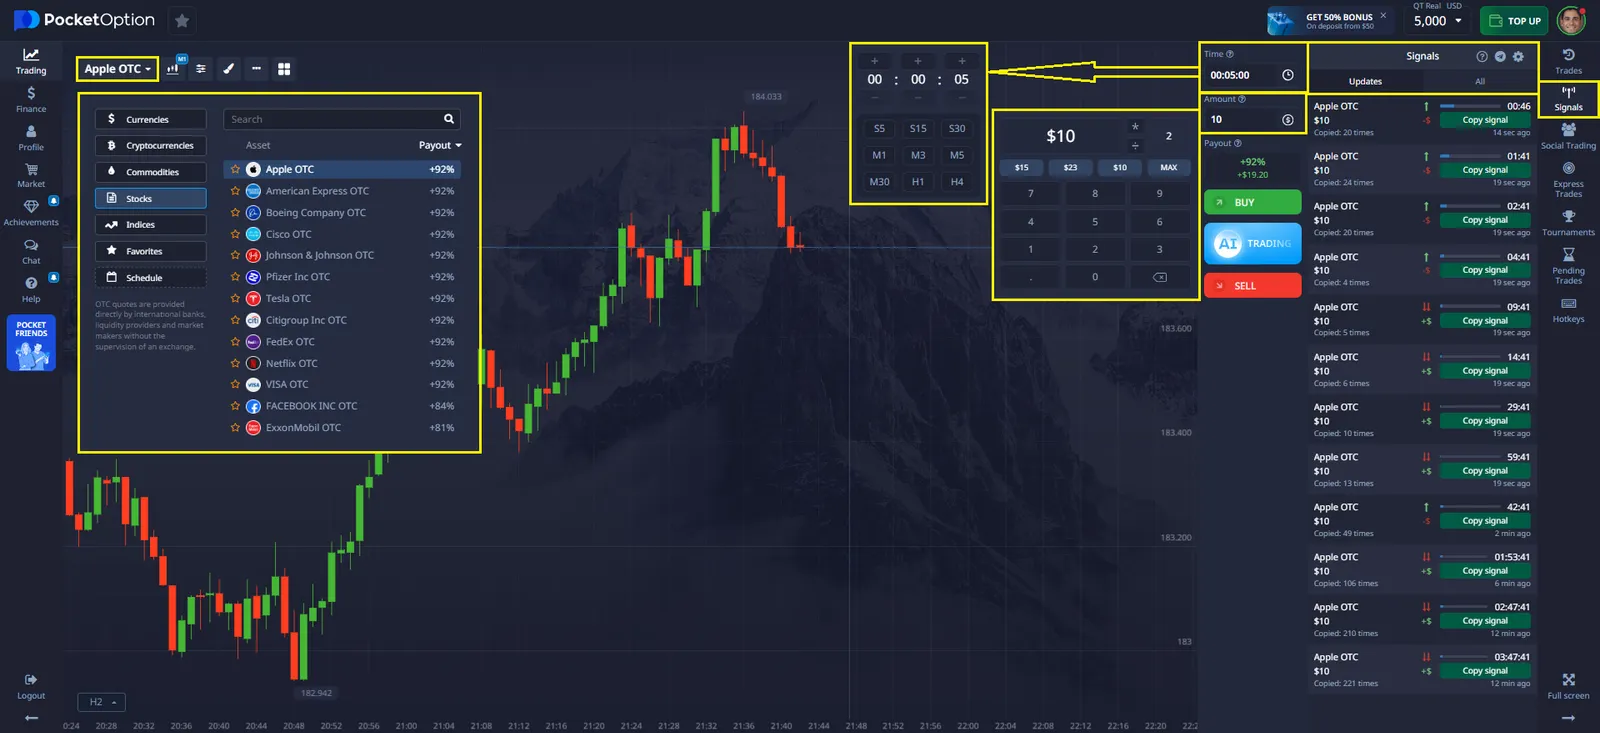
Both tools are designed to improve your trading results by offering fast, clear, and data-backed market signals — right when you need them.
Why Pocket Option is Built for Fast, Data-Driven Signal Trading
Pocket Option is designed to help traders act quickly and efficiently on Quick Trading signals:
- $50,000 demo account for strategy testing
- Quick Trading with flexible timeframes and fixed return logic
- Fast execution — ideal for reacting to real-time signals
- Mobile-friendly platform for trading anywhere
- Integrated risk management: stop-loss and take-profit
- Tournaments, OTC options, and social trading
Trade on-the-go with Pocket Option’s mobile app for real-time signals. Whether you prefer manual setups or automated insights, Pocket Option provides the environment to make every signal count.
FAQ
How are binary options trading signals generated mathematically?
They’re created using algorithms that analyze technical and statistical indicators, price action, and volatility. Each factor is weighted to improve signal accuracy.
What statistical methods are most effective for signal analysis?
MACD, RSI, Bollinger Bands, and standard deviation tools are highly effective in building and verifying trading signals.
How does signal timing affect success rates?
Longer timeframes like 4-hour and daily signals tend to be more reliable, with success rates above 80%, compared to shorter timeframes.
What role do mathematical indicators play in signal generation?
They offer quantitative measurements that help identify trade opportunities and measure signal reliability.
How can traders validate signal quality?
By backtesting results, tracking win rates, calculating risk-reward ratios, and monitoring performance metrics like latency and false signal rate.
CONCLUSION
Binary options trading signals powered by mathematical analysis create a structured framework for decision-making. By understanding signal mechanics, applying metrics, and using platforms like Pocket Option that support real-time execution, traders can move from intuition to informed action. The key is discipline, constant measurement, and a platform that supports precision when working with trading signals for binary options.
Start trading
Comments 1