- Investment analysis
- Credit evaluation
- Internal financial planning
Debt to Tangible Net Worth: A Comprehensive Exploration of Its Significance and Usage

6 min to read

Updated on 10 Sep 2025
This pivotal financial indicator enables investors to appraise a company's financial stability by juxtaposing its debt burden against its tangible assets. This discussion delves into the ratio, its calculation, and the ways investors can decipher it to make astute decisions.
Article navigation
- Start Strong: Why This Ratio Matters in Today’s Market
- What Is Debt to Tangible Net Worth?
- Understanding the DTNW Ratio in Context
- DTNW vs. Other Financial Leverage Metrics
- How to Calculate Tangible Net Worth
- Why Pocket Option Traders Should Care
- Pros and Cons of the DTNW Ratio
- Making the Ratio Work for You
Get Started
New to Quick Trading?
Start analyzing financial ratios and trading popular assets with zero risk—try our demo mode today!
Start Strong: Why This Ratio Matters in Today’s Market
Financial resilience isn’t a luxury–it’s a necessity. For investors navigating unpredictable markets or evaluating stock picks on Pocket Option, the debt to tangible net worth ratio emerges as a critical lens through which to assess a company’s true financial strength. Whether you’re trading blue-chip stocks or exploring growth sectors, understanding this ratio can guide your strategy and risk exposure.
📊 According to a 2024 report by Deloitte, 62% of institutional investors factor in tangible net worth-related metrics when making equity investment decisions–highlighting this ratio’s growing relevance in modern portfolio management.
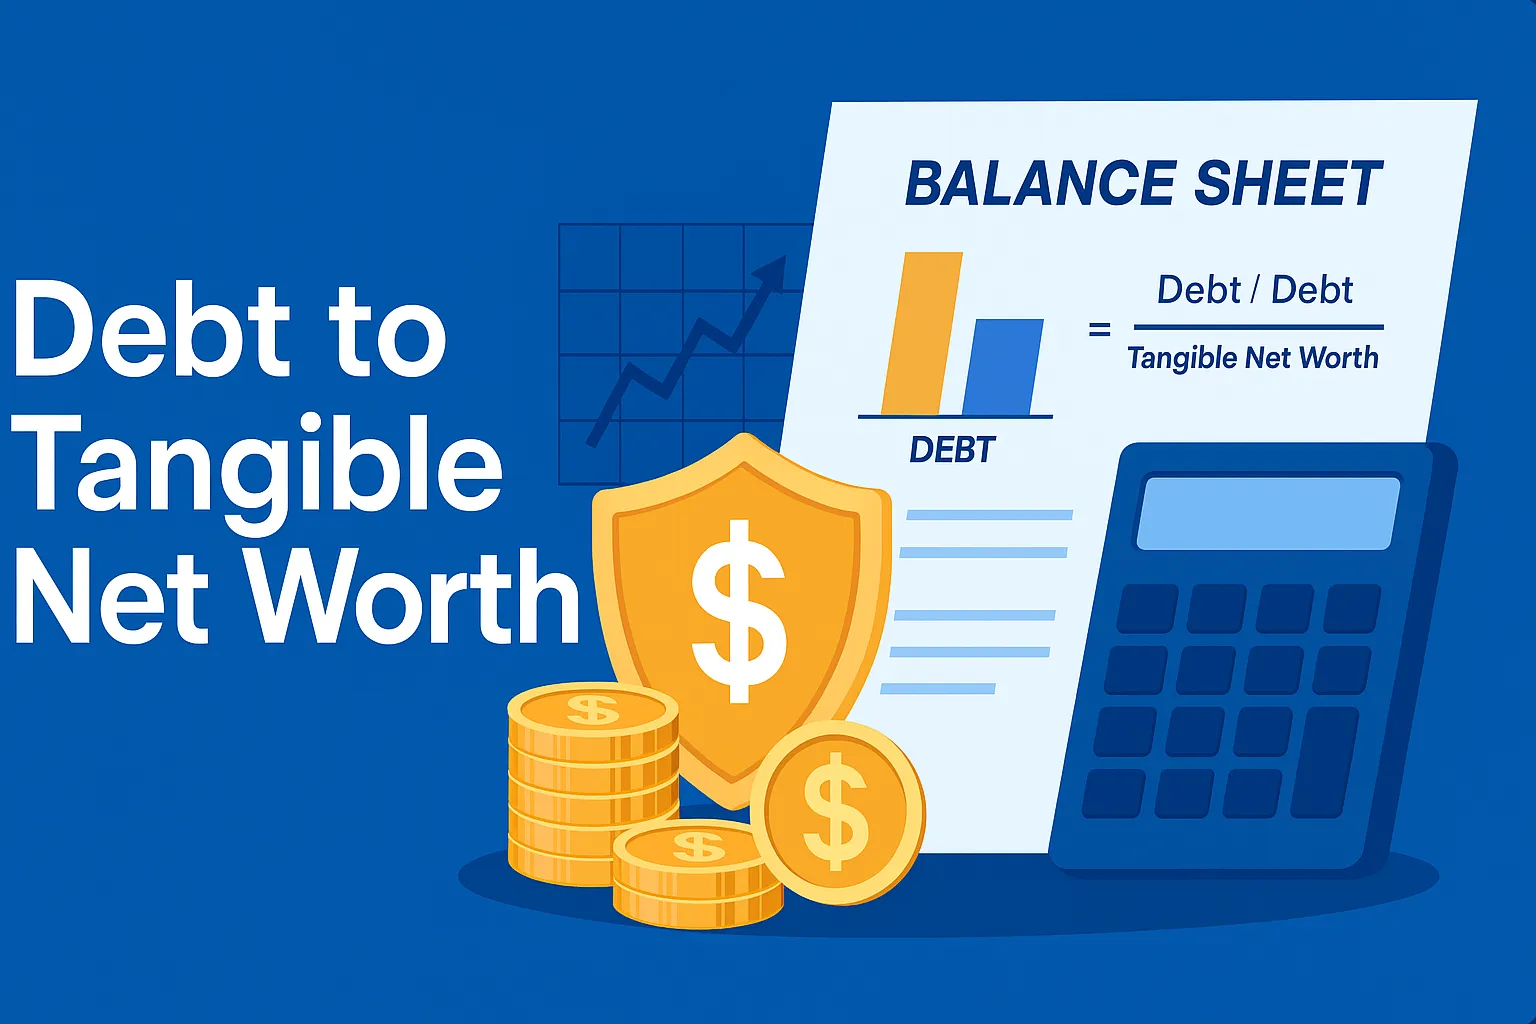
What Is Debt to Tangible Net Worth?
The debt to tangible net worth (DTNW) ratio compares a company’s total debt with its tangible net worth, offering a transparent view of how well its physical and financial assets back up its obligations.
Formula:
Debt to Tangible Net Worth = Total Debt / Tangible Net Worth
Tangible net worth excludes intangible assets like trademarks and goodwill, focusing instead on real, liquid, or physical equity. It provides clarity on a firm’s solvency and ability to sustain itself during financial stress.
Why It’s Important:
This ratio is a key solvency ratio, used widely in:
🎙️ “In times of market uncertainty, DTNW is one of the most telling signs of whether a company can weather the storm,” says Julia Harrows, Senior Analyst at Morningstar.
🧠 Expert Insight: CFOs often rely on the DTNW ratio during strategic planning and capital restructuring, particularly in capital-intensive industries. “It gives us a floor for risk tolerance when debt is part of our expansion strategy,” shared a senior finance executive at Caterpillar in a 2023 WSJ interview.
On platforms like Pocket Option, where traders can access real-time data and financial reports of major companies, incorporating this ratio into stock screening can give you a serious edge.
Understanding the DTNW Ratio in Context
What Does a Good DTNW Ratio Look Like?
There’s no universal “perfect” number–it varies by industry. However:
- Below 1 = strong position (assets > debts)
- Around 1 = balanced
- Above 1 = higher financial risk (debts > assets)
📉 According to S&P Global, companies in the bottom quartile of DTNW ratios were 2.4x more likely to default during financial downturns compared to those in the top quartile.
🔎 Additional Insight: During the COVID-19 financial shock, companies with DTNW below 0.8 outperformed the market by 12% over the next 12 months, according to a 2021 McKinsey study.
📊 Industry Benchmarks for DTNW
| Sector | Acceptable DTNW Range |
|---|---|
| Technology | 0.2 — 0.5 |
| Manufacturing | 0.5 — 1.0 |
| Utilities | 1.0 — 1.5 |
Always compare against historical company performance and peer averages to get meaningful insights.
Practical Example: Apple vs. Microsoft
| Company | Total Debt | Tangible Net Worth | DTNW Ratio |
|---|---|---|---|
| Apple | $100B | $150B | 0.67 |
| Microsoft | $120B | $130B | 0.92 |
This table shows that both companies are financially stable, though Microsoft’s slightly higher ratio could reflect aggressive investment strategies.
🧠 Expert Insight: According to Fidelity’s asset manager commentary (Q2 2025), Apple’s consistently low DTNW ratio supports its premium valuation as a cash-rich tech leader.
DTNW vs. Other Financial Leverage Metrics
While DTNW focuses on tangible backing, other metrics also play a role:
| Metric | Focus |
|---|---|
| Debt to Equity (Tangible) | Compares total debt to equity excluding intangibles |
| Debt Ratio | Total debt vs total assets |
| Equity Ratio | Equity as % of total assets |
Combining these offers a holistic picture of financial leverage.
📌 Insight: According to Investopedia, DTNW is preferred by conservative investors over debt to equity because it removes intangible volatility.
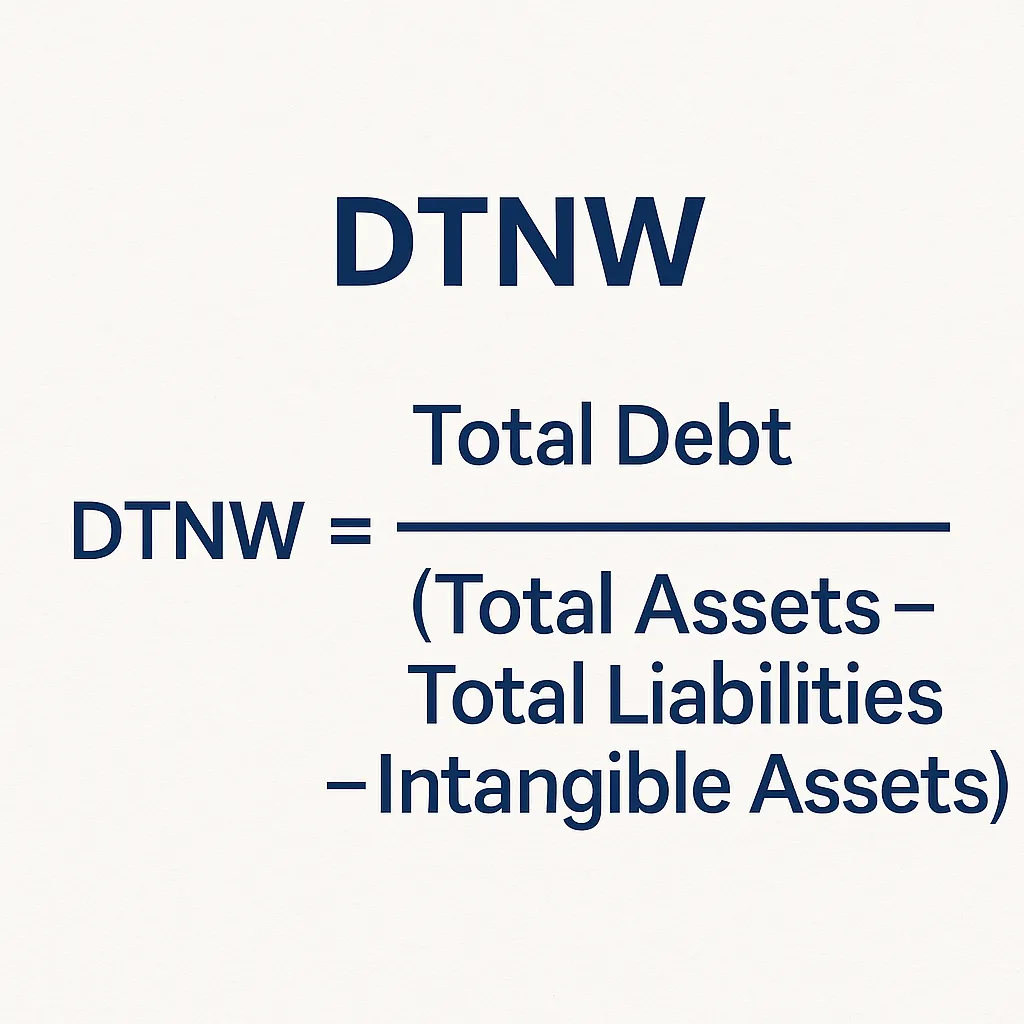
How to Calculate Tangible Net Worth
Tangible Net Worth = Total Assets — Total Liabilities — Intangible Assets
When analyzing a balance sheet, locate:
- Total Assets (from the asset section)
- Total Liabilities (usually current + long-term)
- Intangible Assets (patents, goodwill, etc.)
🚫 Common Mistakes: Many investors mistakenly include deferred tax assets or understate goodwill, skewing the tangible net worth calculation. A 2023 audit review by EY found that 28% of mid-cap investors misreported net worth in valuation models due to this.
📋 Quick Checklist for Tangible Net Worth Calculation:
- Retrieve most recent 10-K filing or balance sheet
- Identify and total tangible assets (exclude goodwill, patents)
- Subtract all liabilities (current + long-term)
- Confirm exclusions from footnotes
- Recalculate annually or after major acquisitions
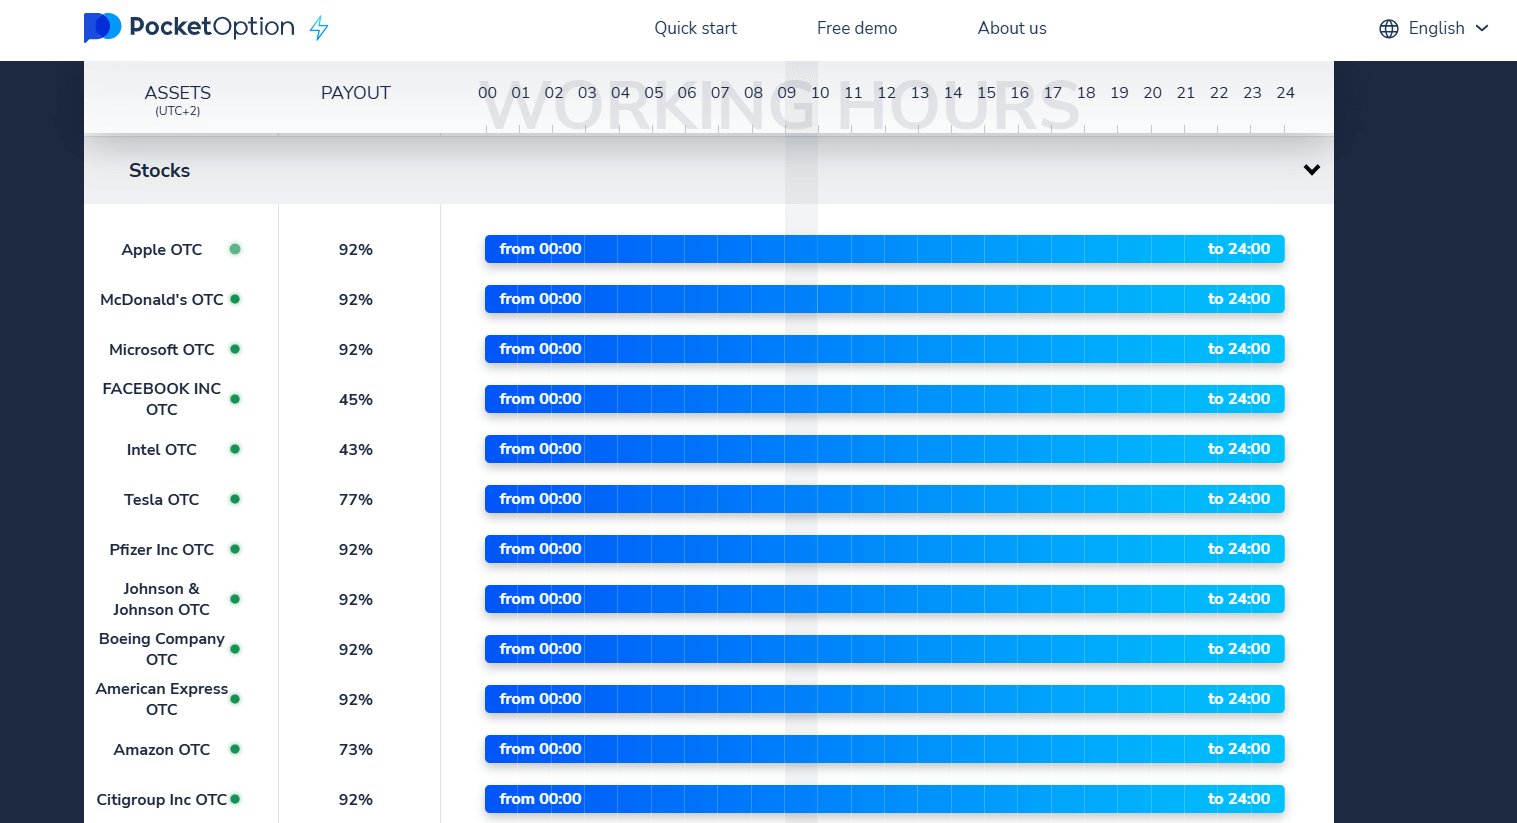
Why Pocket Option Traders Should Care
On Pocket Option, users can trade over 100+ assets, including company stocks, 24/7. Understanding DTNW empowers traders to:
- Filter financially stable stocks
- Avoid overleveraged businesses
- Time entries based on balance sheet strength
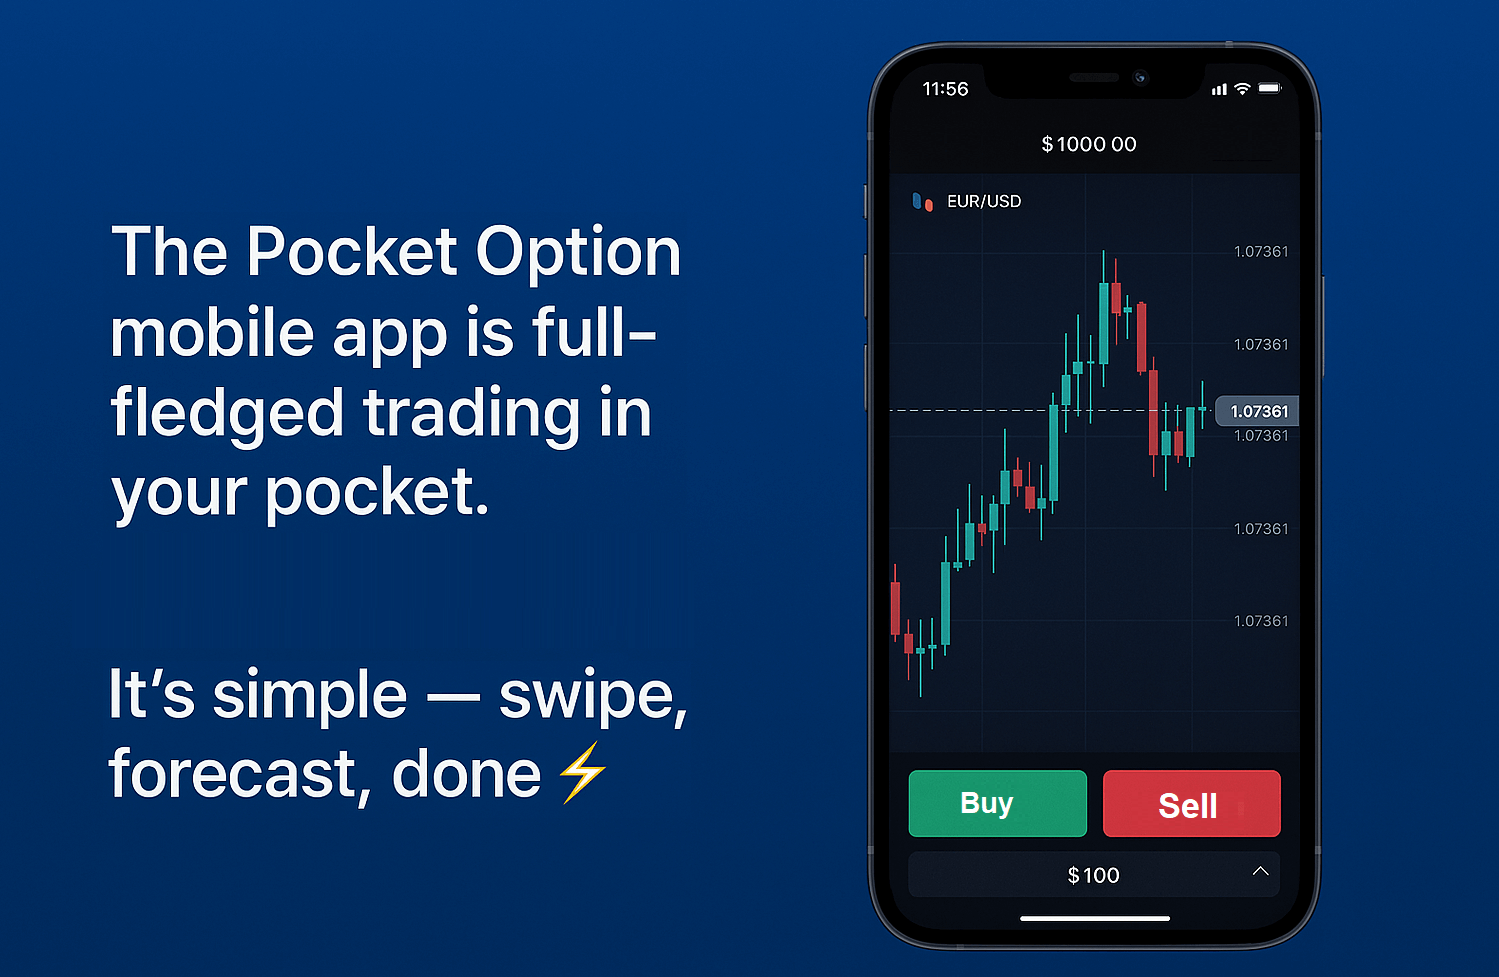
Combine this with Pocket Option’s features like:
- ✅ Social Trading
- ✅ AI Trading Bots
- ✅ Telegram Signal Integration
- ✅ Demo Account with $50,000 virtual funds
- ✅ Low entry threshold: deposit from $5*
…and you get an ideal environment to test and apply these insights.
🎯 Use what the pros use. Warren Buffett famously prioritizes strong tangible equity and low debt. Pocket Option gives you the tools to follow similar principles–right from your phone.
📈 Pro Tip: If you’re using the Pocket Option signal bot, combine alerts with DTNW analysis to filter quality setups from risky ones.
*minimum deposit may vary depending on geo and payment method
Pros and Cons of the DTNW Ratio
| Pros | Cons |
|---|---|
| Simple and quick to calculate | Ignores intangible assets |
| Clear indicator of risk | Industry-specific interpretation needed |
| Widely accepted | May miss rapid changes in capital |
Tip: Use DTNW alongside profitability and growth ratios for a full picture.
Making the Ratio Work for You
How to Incorporate DTNW in Strategy:
- Compare Sector Averages — Use industry-specific norms.
- Look at Trendlines — Has the ratio been improving or worsening?
- Use in Screening Tools — Many stock scanners let you filter by solvency ratio.
- Rebalance Based on Risk Appetite — Low DTNW = safer; high = riskier but possibly high return.
📌 Practical Tool: Platforms like Finviz, Yahoo Finance, and TradingView allow filtering for balance sheet strength using metrics like DTNW and debt to equity tangible.
🧩 Advanced Tip: In private equity and venture investing, some experts like Sequoia Capital advise maintaining a DTNW ratio below 1.0 as part of a broader liquidity risk framework.
📊 AI Insight: J.P. Morgan’s AI portfolio algorithms (Q1 2025) assign DTNW a 17% weighting when filtering stocks for low-volatility dividend portfolios.
FAQ
What is debt to tangible net worth?
It’s a solvency ratio that measures a company’s financial leverage by comparing total debt to tangible net worth (which excludes intangible assets like goodwill and patents).
How do you calculate DTNW?
Use the formula: DTNW = Total Debt / (Total Assets - Total Liabilities - Intangible Assets)
What advantage does the ratio provide in investment analysis?
This metric offers a clear measure of financial leverage, aiding investors in evaluating a company's ability to meet long-term obligations through its tangible assets.
How does the ratio differ across industries?
Industry benchmarks for this metric vary. Capital-intensive sectors might accept higher values due to asset financing, while tech companies may prefer lower values to reflect financial prudence.
What is a good debt to tangible net worth ratio?
Generally, a DTNW ratio under 1 is considered financially healthy. However, acceptable ranges vary by industry—for example, 0.2–0.5 in tech and 1.0–1.5 in utilities.
CONCLUSION
The debt to tangible net worth ratio isn’t just a number—it’s a reflection of a company’s core financial health. For smart traders on Pocket Option, incorporating this metric can elevate your strategy from reactive to proactive. 🗣️ "Incorporating DTNW into your trading toolkit helps cut through hype and see the foundation of a company," notes Brian Yorke, financial advisor at Vanguard. Don’t just trade—trade smart.
Start tradingAbout the author :
Trading
Sign up for more like this
Customize your newsfeed with content you're actually interested in — get up-to-date personalized newsletter in your inbox.
Your comment
Comments are pre-moderated to ensure they comply with our blog guidelines.