- Opening Price (Open): The price at which the asset was traded at the beginning of the selected period.
- Closing Price (Close): The price at which the asset was traded at the end of the selected period.
- Highest Price (High): The highest price reached by the asset during the period.
- Lowest Price (Low): The lowest price reached by the asset during the period.
Candlestick Trading Chart: Master Market Analysis with Pocket Option
Updated on 15 Aug 2025
A Candlestick Trading Chart visually displays prices and reveals market psychology, helping traders understand sentiment and anticipate price movements.
Article navigation
- Definition of Candlestick Charts: The Visual Language of the Market
- Advantages of Candlestick Analysis Over Other Chart Types
- Basics of Candlestick Chart Analysis: How to Read Candlestick Charts
- Candlestick Chart for Beginners: Step-by-Step Guide for New Traders
- Main Candlestick Patterns: Single Patterns and Their Meaning
- Best Candlestick Patterns for Trading: Choosing the Most Effective Patterns
- Market Psychology Through the Lens of Candlestick Charts
- Candlestick Chart Trading Strategy: Developing a Trading System
- Candlestick Analysis for Different Timeframes
- Unique Features of Pocket Option for Candlestick Analysis
- Mobile Analysis: Working with Candlesticks in the Pocket Option App
- Social Trading: Sharing Ideas on Candlestick Analysis
- Educational Resources on Candlestick Charts at Pocket Option
- Advanced Candlestick Analysis Techniques and Their Application
- Practical Examples of Trading Using Candlestick Charts
- Risk and Capital Management in Candlestick Chart Trading
- Frequently Asked Questions (FAQ) about Candlestick Trading Charts
Definition of Candlestick Charts: The Visual Language of the Market
A candlestick chart is a type of financial chart used to display the price movement of an asset over a specific period of time. Each “candlestick” on the chart represents a complete picture of price action for the selected interval (for example, 1 minute, 1 hour, 1 day). Unlike simple line charts, which show only the closing price, or bar charts, candlesticks provide much more information, showing four key price points:
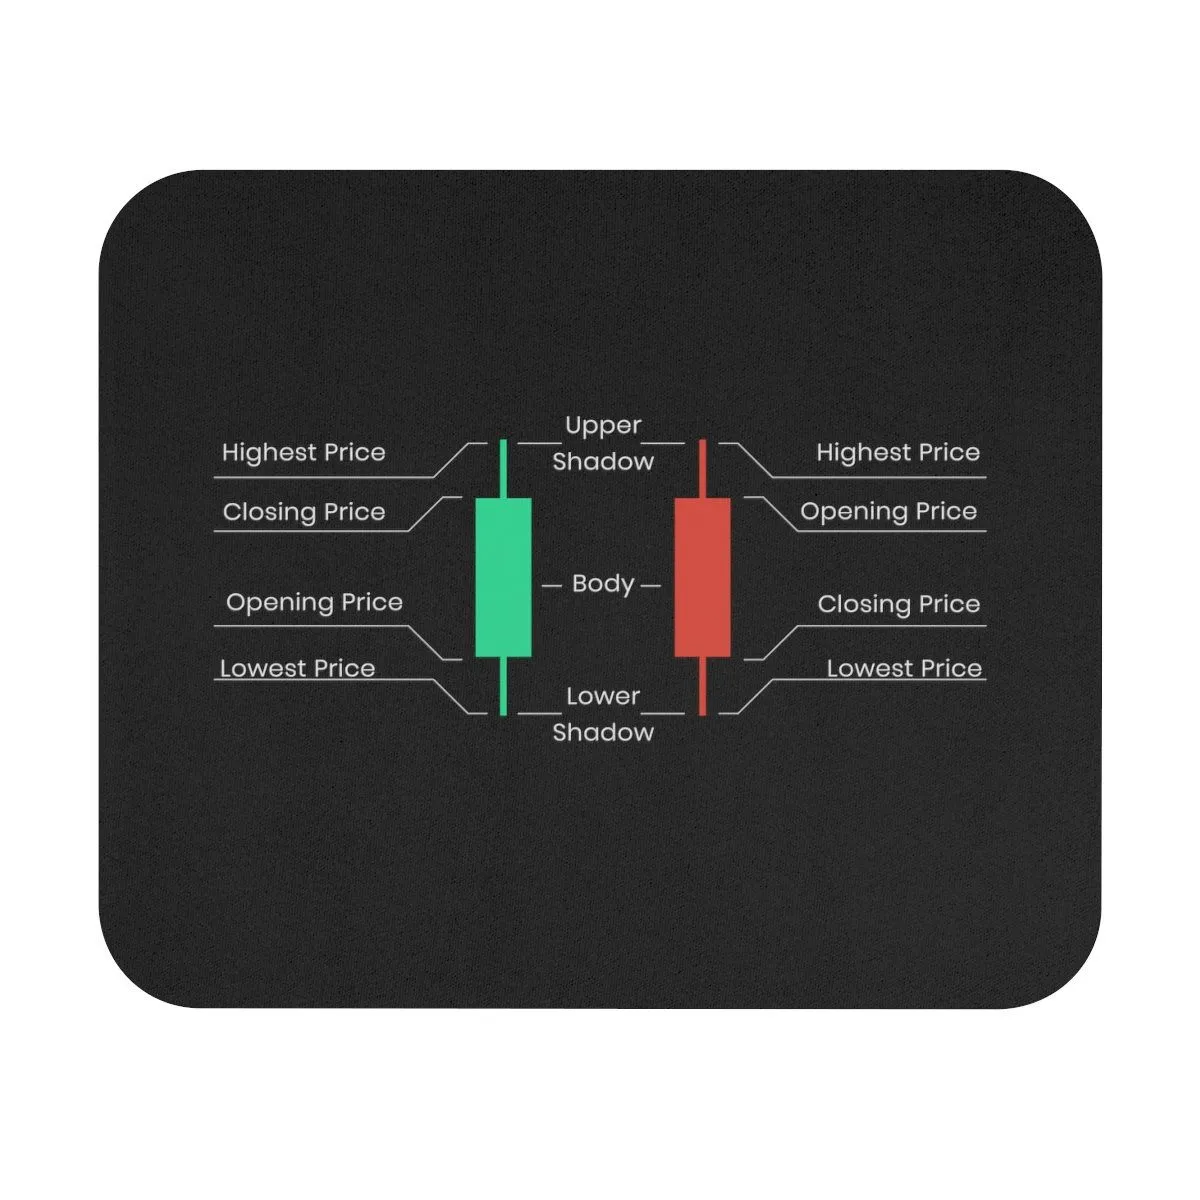
This information is visualized in the form of the candlestick’s “body” and “shadows” (or “wicks”). The body of the candlestick shows the range between the opening and closing prices, while the shadows indicate the highest and lowest prices. The color of the candlestick body usually indicates the direction of the price movement: a green (or white) candlestick means that the closing price was higher than the opening price (bullish rise), while a red (or black) candlestick means that the closing price was lower than the opening price (bearish fall). Such clarity makes candlestick charts an indispensable tool for quickly analyzing the market situation.
History of Origin: Japanese Candlesticks and Their Wisdom
The history of candlestick charts dates back to 18th-century Japan, where they were developed by Munehisa Homma, a rice trader from Sakata. Homma used these charts to analyze rice prices and forecast future market movements. His methods, based on observing price behavior and the psychology of market participants, proved so effective that they earned him a huge fortune and the nickname “God of the market.”
Candlestick charts only entered the Western world at the end of the 20th century thanks to Steve Nison, who introduced them in his book Japanese Candlestick Charting Techniques. Since then, they have become one of the most popular and widely used tools of technical analysis among traders worldwide. The wisdom of Japanese candlesticks lies not only in their ability to display price data but also in their capacity to reflect the emotional state of the market and the battle between buyers and sellers, enabling traders to make more informed decisions.
Why Pocket Option is the Best Platform for Working with Candlestick Charts
Choosing a trading platform plays a key role in the effectiveness of using candlestick charts. Pocket Option stands out as one of the best platforms for Candlestick Trading Chart analysis for several reasons:
- Intuitive interface: The Pocket Option platform is designed with the needs of both beginners and experienced traders in mind. Setting up candlestick charts, changing time intervals, and adding indicators can be done in just a few clicks, allowing you to focus on analysis rather than learning the interface.
- Wide range of assets: Pocket Option provides access to more than 100 trading assets, including currency pairs, stocks, indices, commodities, and cryptocurrencies. This allows you to apply candlestick analysis across various markets and diversify your trading strategies.
- Advanced analysis tools: The platform offers 30+ technical indicators and charting tools that integrate seamlessly with candlestick charts. This allows for comprehensive analysis, confirming candlestick signals with data from other indicators.
- Customizable time intervals: In Pocket Option, you can select candlestick time intervals from a few seconds to several days, making the platform ideal for scalping, day trading, and swing trading.
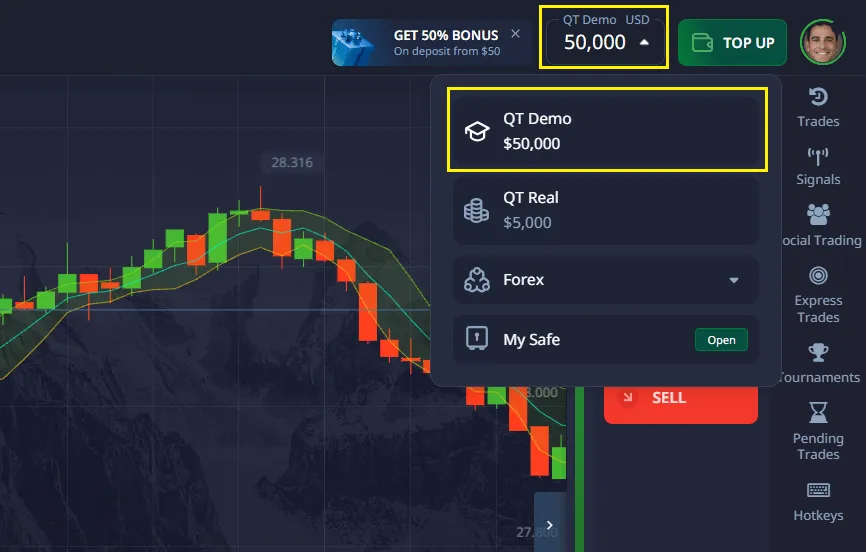
- Demo account: For beginners, Pocket Option offers a free Pocket Option demo account with virtual $50,000, which can be replenished. This is the perfect opportunity to safely learn the basics of analysis, practice reading candlesticks, test strategies, and master the platform using a Candlestick chart for beginners without the risk of losses.
- High performance: The trading platform ensures stable and fast chart performance, which is critically important for traders who need to react instantly to market changes.
Advantages of Candlestick Analysis Over Other Chart Types
While there are other types of charts (line, bar, Renko, Kagi), candlestick charts have a number of unique advantages that make them the preferred choice for most traders:
- Maximum informativeness: Each candlestick provides a complete picture of price action for the period, including the open, close, high, and low. This allows you to get much more information than, for example, a line chart, which shows only the closing price.
- Visual clarity: Candlesticks are intuitive and easy to read. Their shape, size, and color instantly convey information about the strength of buyers and sellers, volatility, and the direction of price movement.
- Psychological aspect:Candlestick patterns reflect market psychology and the battle between bulls and bears. They can signal trend reversals, continuation, or uncertainty, which helps traders make more informed decisions.
- Versatility: Candlestick charts can be used in any financial markets (stocks, forex, cryptocurrencies, commodities) and on any time intervals, from seconds to months.
- Combination with other tools: Candlestick analysis combines perfectly with other technical analysis tools, such as indicators, support and resistance levels, and trend lines, which allows you to create comprehensive and effective trading strategies.
In the following chapters, we will delve into Candlestick chart analysis, review the main Candlestick patterns, learn How to read candlestick charts, and develop an effective Candlestick chart trading strategy on the Pocket Option platform. Get ready to master this powerful tool and take your trading to the next level.
Basics of Candlestick Chart Analysis: How to Read Candlestick Charts

To effectively use candlestick charts in trading, it is necessary to understand their basic structure and formation principles. Each candlestick is not just a graphical element, but a concentrated representation of price action over a specific period of time. Understanding the anatomy of a candlestick and how it is formed is the first and most important step to mastering Candlestick chart analysis.
Anatomy of a Candlestick: Body, Shadows, Open, Close
Each candlestick consists of two main parts: the body and the shadows (or “wicks”). These elements together provide complete information about price movement for the selected time interval.
- Real Body: This is the rectangular part of the candlestick that shows the range between the opening price and the closing price. The color of the candlestick body is a key indicator of the price movement direction:
- Green (or white) body: Indicates that the closing price was higher than the opening price. This points to a bullish market sentiment, where buyers dominated sellers during the period.
- Red (or black) body: Indicates that the closing price was lower than the opening price. This points to a bearish market sentiment, where sellers dominated buyers.
- Shadows: These are thin lines extending beyond the candlestick body. They show the maximum and minimum price reached by the asset during the period:
- Upper shadow: Extends from the top of the body to the highest price. It shows the highest level the price reached during the period.
- Lower shadow: Extends from the bottom of the body to the lowest price. It shows the lowest level the price dropped to during the period.
Thus, each candlestick gives us four important price points: opening price, closing price, highest price, and lowest price. The combination of these four elements allows a trader to quickly assess volatility, the strength of the move, and potential reversal points.
Bullish and Bearish Candlesticks: Indicators of Market Strength
The color and size of the candlestick body are powerful indicators of the strength of buyers (bulls) and sellers (bears) in the market:
- Bullish candlestick: Usually green or white. The closing price is higher than the opening price. A long green body indicates strong buying pressure and an upward trend. The longer the body, the stronger the buyers. A short green body may indicate weak bullish movement or uncertainty.
- Bearish candlestick: Usually red or black. The closing price is lower than the opening price. A long red body indicates strong selling pressure and a downward trend. The longer the body, the stronger the sellers. A short red body may indicate weak bearish movement or uncertainty.
By analyzing the length of the body and the shadows, traders can gain an understanding of who controls the market at the moment and how strong that control is. For example, a long bullish candlestick with short shadows shows that buyers confidently pushed the price up and seller resistance was minimal.
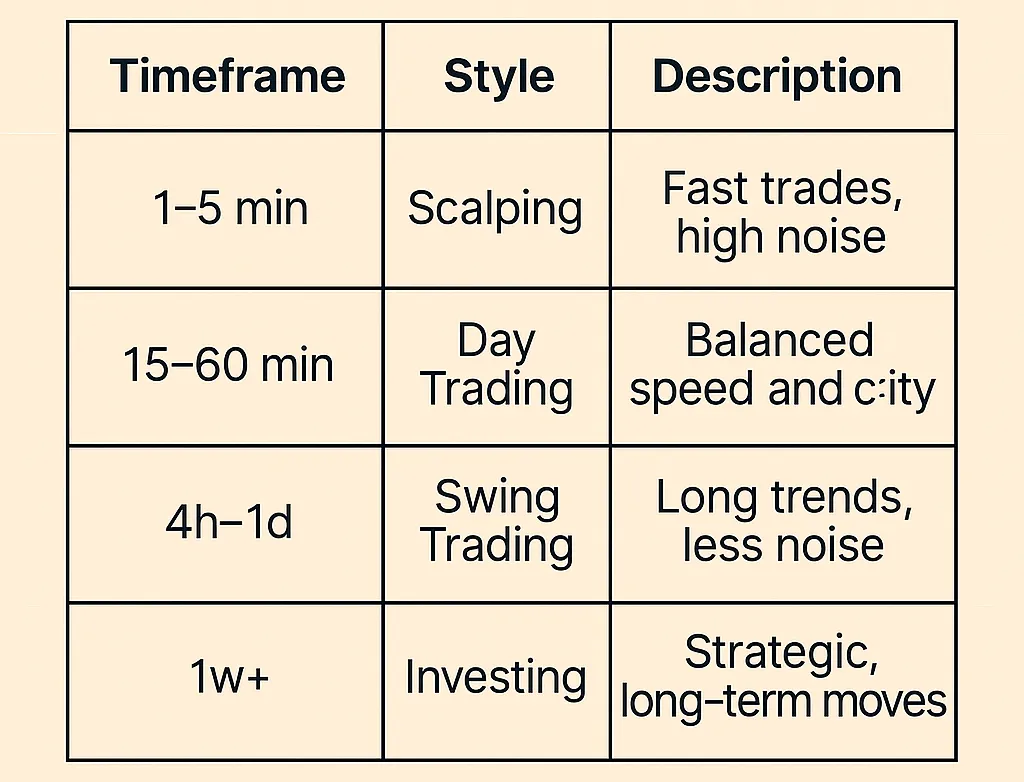
Time Intervals and Their Significance: Choosing the Scale of Analysis
One of the key advantages of candlestick charts is their flexibility in terms of time intervals (timeframes). You can choose any interval that matches your trading strategy:
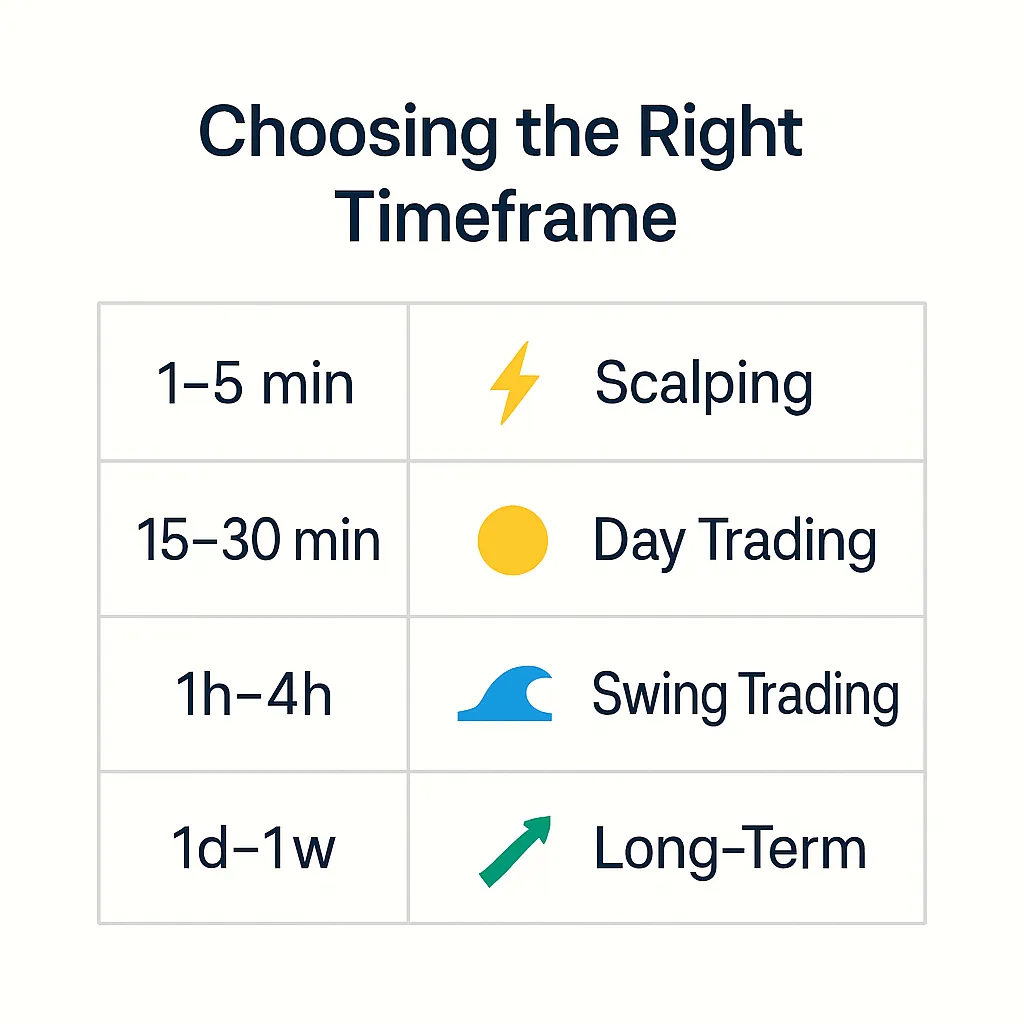
- Short timeframes (1–5 minutes): Ideal for scalping and high-frequency trading, where traders aim to profit from small price fluctuations. In these intervals, each candlestick shows the price action for 1 or 5 minutes.
- Medium timeframes (15 minutes – 1 hour): Often used by day traders who open and close trades within a single trading day. These intervals provide a smoother market picture than short timeframes, while still allowing quick reactions to changes.
- Long timeframes (4 hours – daily, weekly, monthly): Suitable for swing traders and long-term investors. In these intervals, each candlestick aggregates a large amount of data, which allows identifying long-term trends and key support/resistance levels. Market noise is significantly reduced on these timeframes.
Choosing the right timeframe depends on your trading style and goals. It is important to remember that candlesticks on longer timeframes carry more weight and reliability, as they include more data. Experienced traders often use multi-timeframe analysis, viewing charts across several intervals to confirm signals and get a more complete picture of the market.
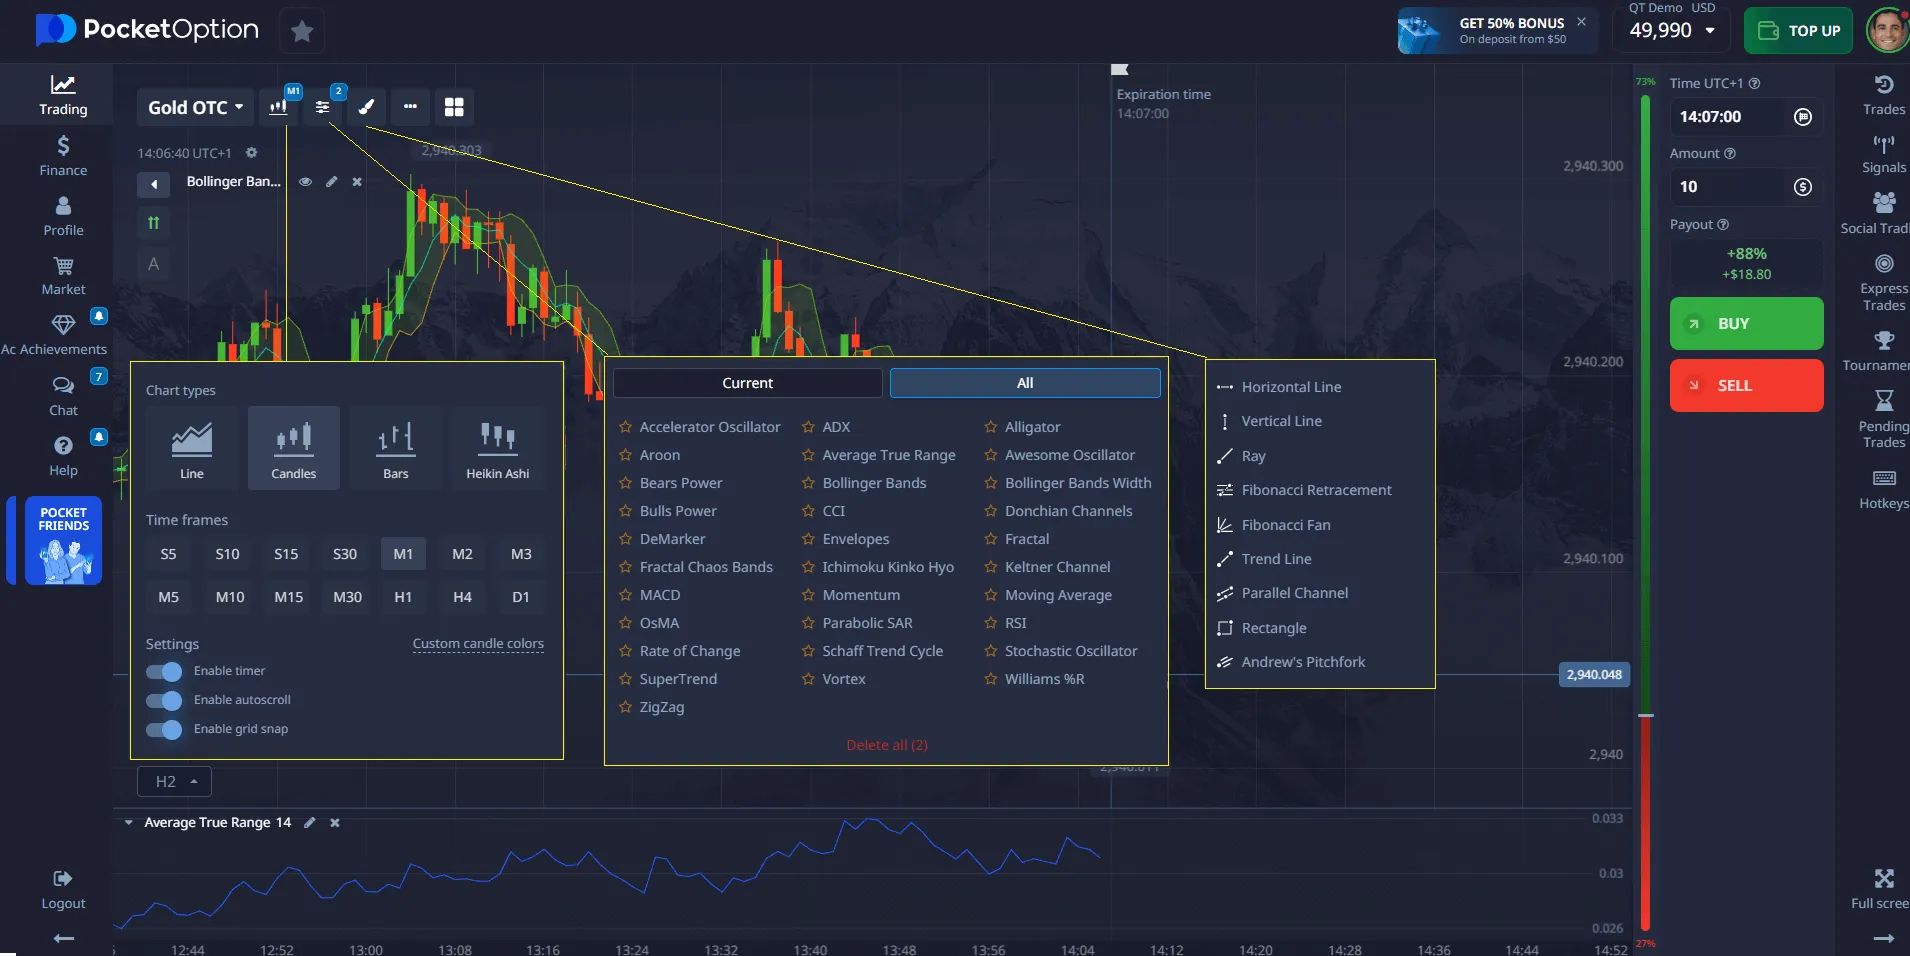
How to Set Up Candlestick Charts in Pocket Option
The Pocket Option platform provides intuitive tools for customizing candlestick charts, allowing traders to adapt them to their individual preferences and analytical needs. To set up candlestick charts in Pocket Option, follow these steps:
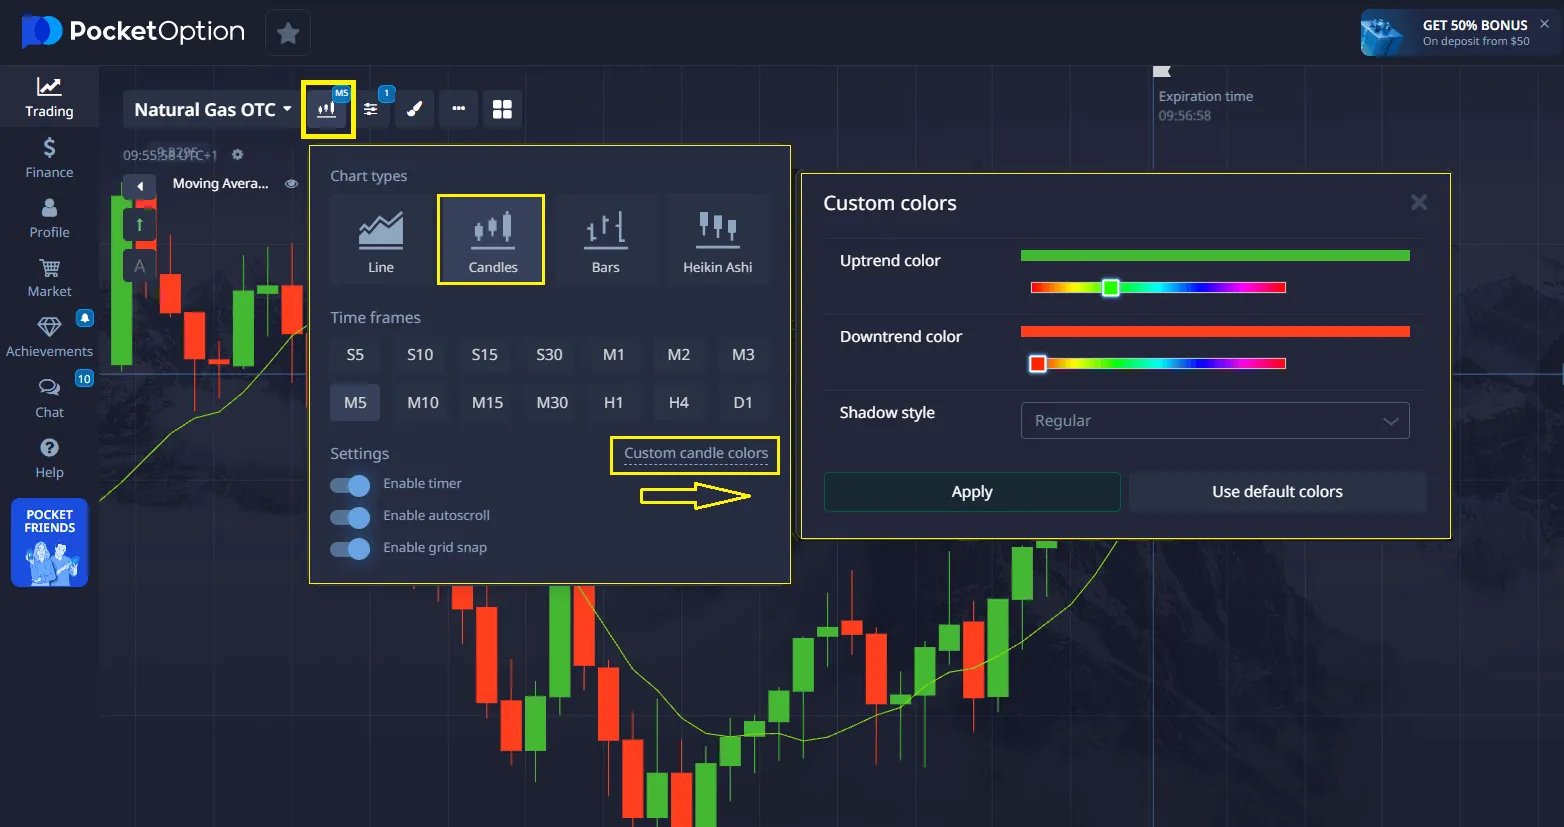
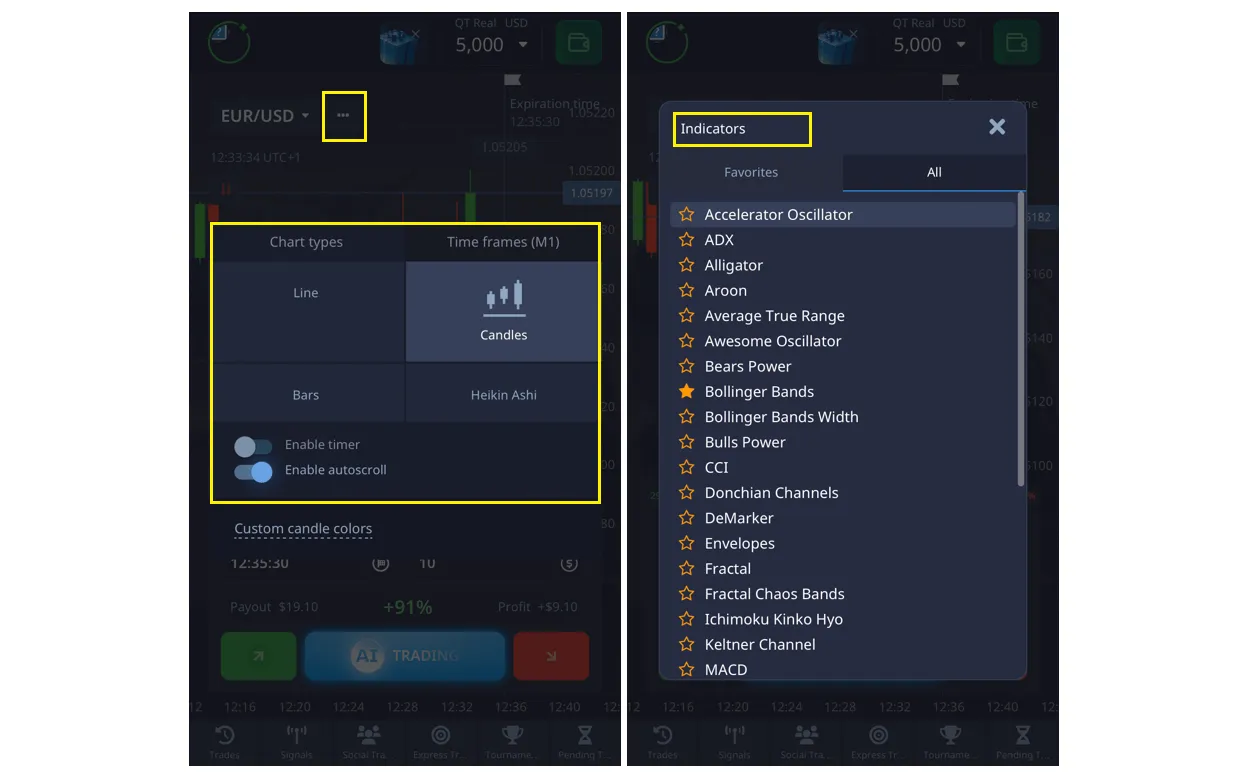
- Select the chart type: On the Pocket Option trading platform, find the chart type selection button (located at the top of the trading interface). Click on it and select “Candlesticks” from the drop-down list. This will instantly change the price chart display to a candlestick chart.
- Select the timeframe: Next to the chart type selection button, you will find an option to choose the timeframe. Click on it, and a list of available timeframes will appear, such as 5 seconds, 10 seconds, 15 seconds, 30 seconds, 1 minute, 5 minutes, 15 minutes, 30 minutes, 1 hour, 4 hours, 1 day, 1 week, 1 month. Choose the interval that matches your trading strategy. For example, day trading often uses 5-minute or 15-minute candlesticks.
- Customize the appearance: Pocket Option allows you to adjust the candlestick color scheme. Typically, green is used for bullish candlesticks and red for bearish ones. You can change these colors in the platform settings to make them more comfortable for your eyes or to match your personal preferences. You can also adjust candlestick thickness, grid display, volume, and other chart elements.
Color Scheme and Display Settings
The standard color scheme for candlestick charts includes green (or white) for bullish candlesticks and red (or black) for bearish candlesticks. However, Pocket Option offers flexible settings that allow you to personalize the chart’s appearance:
- Bullish candlestick color: You can choose any color for candlesticks where the closing price is higher than the opening price. Traditionally, this is green or white.
- Bearish candlestick color: Similarly, you can choose the color for candlesticks where the closing price is lower than the opening price. Traditionally, this is red or black.
- Shadow color: Shadows are usually displayed in the same color as the candlestick body or in a neutral color such as gray or black.
- Chart background: You can choose a light or dark background depending on your preferences and lighting conditions. A dark background is often preferred for extended analysis, as it reduces eye strain.
- Additional elements: In the chart settings, you can also enable or disable the display of:
- Grid: For more accurate determination of price levels.
- Volume: For analyzing trading activity.
- Indicator lines: If you use technical indicators, you can customize their color, thickness, and style.
Candlestick Chart for Beginners: Step-by-Step Guide for New Traders
Starting with a Candlestick trading chart may seem complicated, but with the right approach and practice, any beginner can master this powerful tool. This chapter is designed for those who are just starting their trading journey and want to understand how to use candlestick charts to make informed decisions. We will cover the first steps, the basic principles of reading candlesticks, methods for identifying trends, and common mistakes to avoid.
First Steps in Candlestick Chart Analysis: Where to Start?
For a beginner trader, it’s important not to overload yourself with information. Start with the basics and gradually move into more complex concepts. Here are a few key steps:
- Choose a reliable platform: As we have already discussed, Pocket Option is an excellent choice thanks to its intuitive interface and the availability of a demo account. This allows you to practice without the risk of losing real funds.
- Learn candlestick anatomy: Make sure you clearly understand what the candlestick body and shadows mean, as well as the opening, closing, high, and low prices. This is the foundation of all candlestick analysis.
- Start with one timeframe: At first, choose one timeframe, such as 5 minutes or 1 hour. This will help you focus on candlestick formation and avoid market “noise,” which is often present on shorter intervals.
- Observe and analyze: Spend time simply watching how candlesticks form on the chart. Try to guess what they indicate about market sentiment. This develops intuition and an understanding of price action.
Basic Principles of Reading Candlesticks: What Does Each Candlestick Say?
Each candlestick tells its own story about the battle between buyers and sellers. Here are some basic principles that will help you with How to read candlestick charts:
- Long green body: Strong bullish movement. Buyers dominate, and the price rises confidently. The longer the body, the stronger the buyers.
- Long red body: Strong bearish movement. Sellers dominate, and the price drops confidently. The longer the body, the stronger the sellers.
- Short body (any color): Uncertainty or consolidation. Neither buyers nor sellers have a clear advantage. Often seen before a reversal or trend continuation.
- Long shadows: Indicate high volatility and struggle. A long upper shadow with a short body may signal seller pressure from above, while a long lower shadow may indicate buyer pressure from below.
- No shadows: If a candlestick has no shadows, it means the opening/closing price was also the highest/lowest price for the period, indicating very strong one-directional movement.
How to Identify a Trend Using Candlesticks: Visual Clues
Candlestick charts are excellent for identifying trends. Here’s how you can use them for this purpose:
- Uptrend: Characterized by a sequence of higher highs and higher lows. On the chart, you will see more green candlesticks, often with long bodies, and short red candlesticks. Each new candlestick closes higher than the previous one, or its low is higher than the previous low.
- Downtrend: Characterized by a sequence of lower highs and lower lows. The chart will have more red candlesticks, often with long bodies, and short green candlesticks. Each new candlestick closes lower than the previous one, or its high is lower than the previous high.
- Sideways trend (Sideways/Consolidation): The price moves in a narrow range without a clear direction. Candlesticks often have short bodies and long shadows, indicating uncertainty and balance between buyers and sellers.
It is important to remember that a trend is best confirmed by several candlesticks, not just one. Look for sequences and the overall picture rather than individual candlesticks.
Practical Exercises on the Pocket Option Demo Account: Learning Without Risk
The best way to master Candlestick chart for beginners is through practice. The Pocket Option demo account provides the perfect environment for this. Use it for the following exercises:
- Identifying candlesticks: Open the platform, select any asset, and a 5-minute timeframe. Try to identify each candlestick: bullish or bearish, long or short body, presence and length of shadows. Think about what each candlestick says about the market.
- Determining the trend: Switch to a 1-hour timeframe. Try to determine the current trend (uptrend, downtrend, sideways) using only candlesticks. Note how the trend changes and which candlesticks precede these changes.
- Forecasting: After identifying the trend, try to predict how the next candlestick will close based on the current one. Do not open trades—just observe and compare your forecasts with the actual result.
- Pattern testing: In the next chapters, we will cover specific candlestick patterns. Once you learn them, go back to the demo account and look for these patterns on the chart. Note how the price reacts after they appear.
Common Beginner Mistakes: What to Avoid
Avoiding common mistakes will help you progress faster in Candlestick chart analysis:
- Trading on timeframes that are too short: Beginners often try to trade on 1-minute or 5-minute charts, where there is a lot of market noise. This leads to false signals and quick losses. Start with longer timeframes (15 minutes, 1 hour) to get a clearer picture.
- Ignoring context: Do not look at candlesticks in isolation. Always consider the overall trend, support/resistance levels, and other factors. A single candlestick rarely provides the full picture.
- Overconfidence: After a few successful trades, beginners often switch to a real account with larger amounts. Remember that a demo account is for practice. Real trading requires discipline and emotional control.
- Lack of risk management: Never risk more than you can afford to lose. Always use stop-losses and take-profits, even on a demo account, to develop proper habits.
- Chasing every signal: Not every candlestick or pattern is a trading signal. Be selective and trade only when you see clear and confirmed signals. Fewer but higher-quality trades are better than many random ones.
Mastering candlestick charts is a process that requires time and patience. But with consistent practice and careful study of Candlestick chart trading strategy principles, you can significantly improve your trading skills and make more confident decisions in the market.
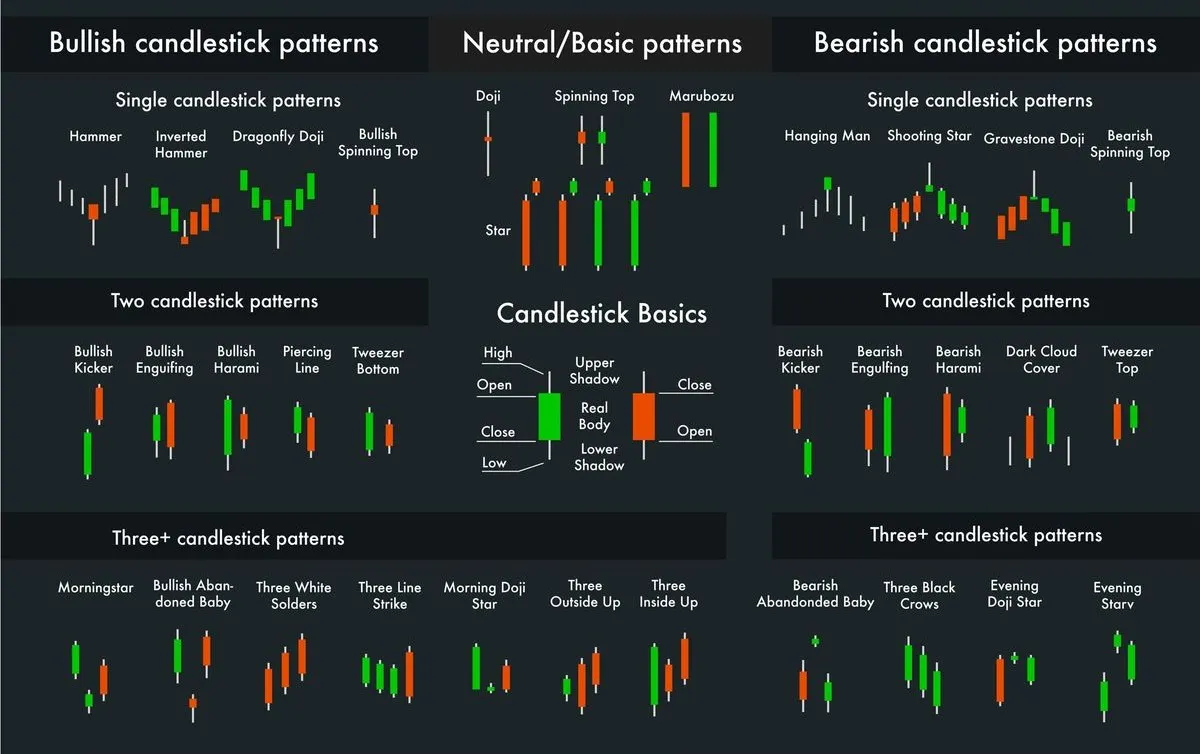
Main Candlestick Patterns: Single Patterns and Their Meaning

Once you have mastered the anatomy of a candlestick and learned to read basic signals, it is time to dive deeper into the world of Candlestick patterns. These patterns, formed by one or more candlesticks, are powerful indicators of potential trend reversals, continuation of movement, or market uncertainty. Understanding their meaning and being able to recognize them on the chart is the key to successful trading.
In this chapter, we will look at the most important single patterns and their interpretation.
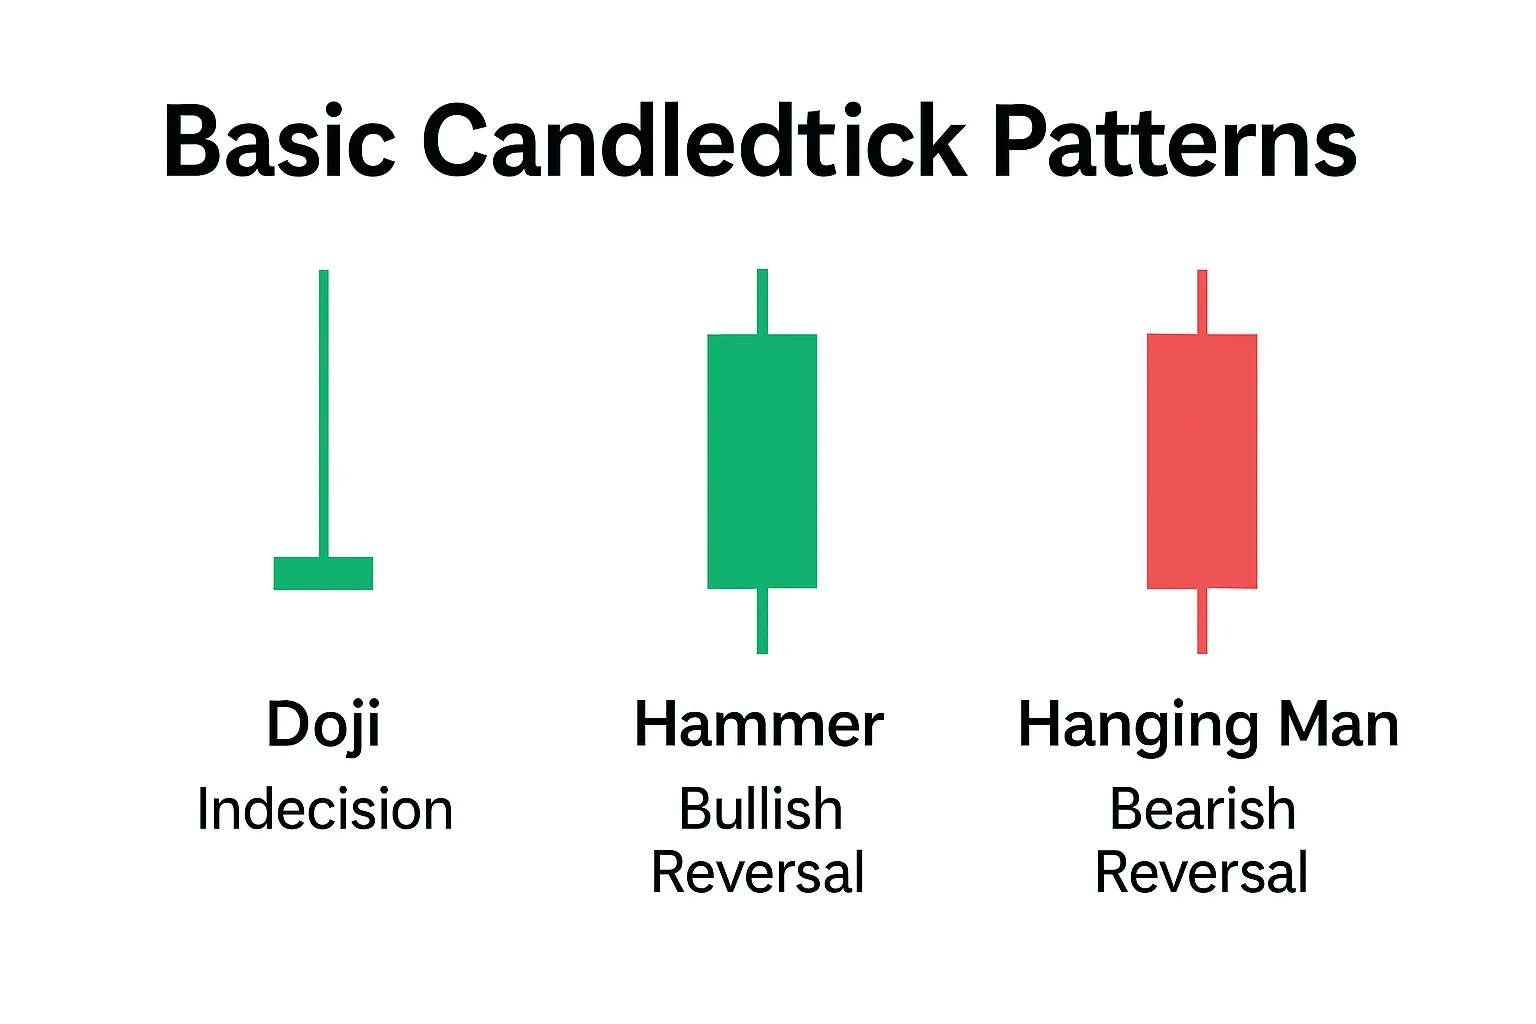
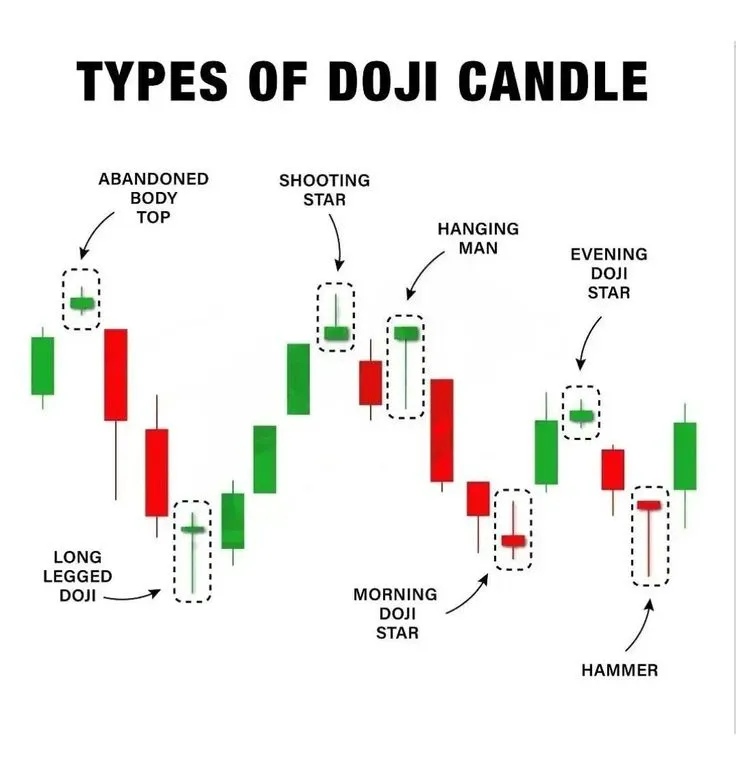
Doji: A Signal of Uncertainty and Potential Reversal

Doji is one of the most recognizable and significant Candlestick patterns. It forms when the opening price and the closing price of the candlestick are almost identical, creating a very short body. The length of the shadows can vary. A Doji indicates market indecision, where neither buyers nor sellers have managed to take control. This state of balance often precedes a change in the trend direction.
There are several types of Doji, each carrying its own nuance of meaning:
- Standard Doji: Short shadows indicating general indecision.
- Long-Legged Doji: Long upper and lower shadows indicating high volatility and a strong battle between bulls and bears, but without a clear winner.
- Dragonfly Doji: The open, close, and high are at the same level, with a very long lower shadow. This is a bullish signal, showing that sellers tried to push the price down but buyers managed to bring it back to the opening/closing level. It often appears at the bottom of a downtrend and signals an upward reversal.
- Gravestone Doji: The open, close, and low are at the same level, with a very long upper shadow. This is a bearish signal, showing that buyers tried to push the price up but sellers managed to bring it back to the opening/closing level. It often appears at the top of an uptrend and signals a downward reversal.
It is important to remember that a Doji by itself is not an unambiguous reversal signal. Its significance increases when it appears after a prolonged trend or near important support/resistance levels. Always look for confirmation from subsequent candlesticks or other indicators.
Hammer and Hanging Man: Key Trend Reversal Signals
Hammer and Hanging Man are single candlestick patterns that have the same shape but different meanings depending on the context in which they appear. Both patterns are characterized by a small body (bullish or bearish), a long lower shadow (at least twice the length of the body), and a very short or absent upper shadow.
- Hammer: This is a bullish reversal pattern that appears after a downtrend. It indicates that sellers tried to push the price down, but buyers managed to bring it back up, closing the candlestick in the upper part of the range. The long lower shadow shows strong buying pressure. The Hammer signals a possible end to the downtrend and the start of upward movement.
- Hanging Man: This is a bearish reversal pattern that appears after an uptrend. It indicates that buyers tried to push the price up, but sellers managed to bring it down, closing the candlestick in the lower part of the range. The long lower shadow here shows strong selling pressure. The Hanging Man signals a possible end to the uptrend and the start of downward movement.
The body color (green/red) is not decisive for these patterns, although a green Hammer and a red Hanging Man are considered stronger signals. The main factors are the candlestick’s shape and its position relative to the previous trend.
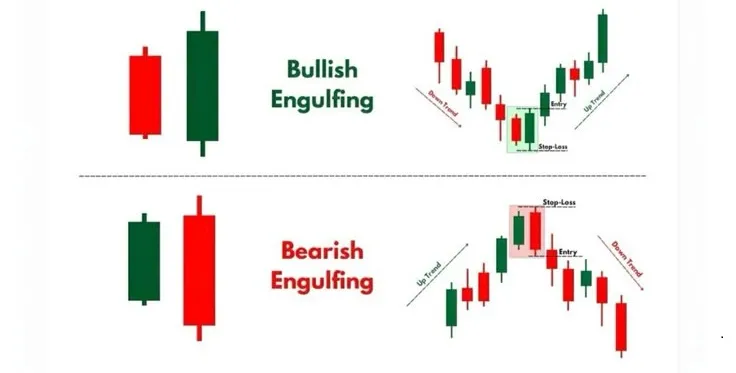
Engulfing: When One Candlestick Covers the Previous
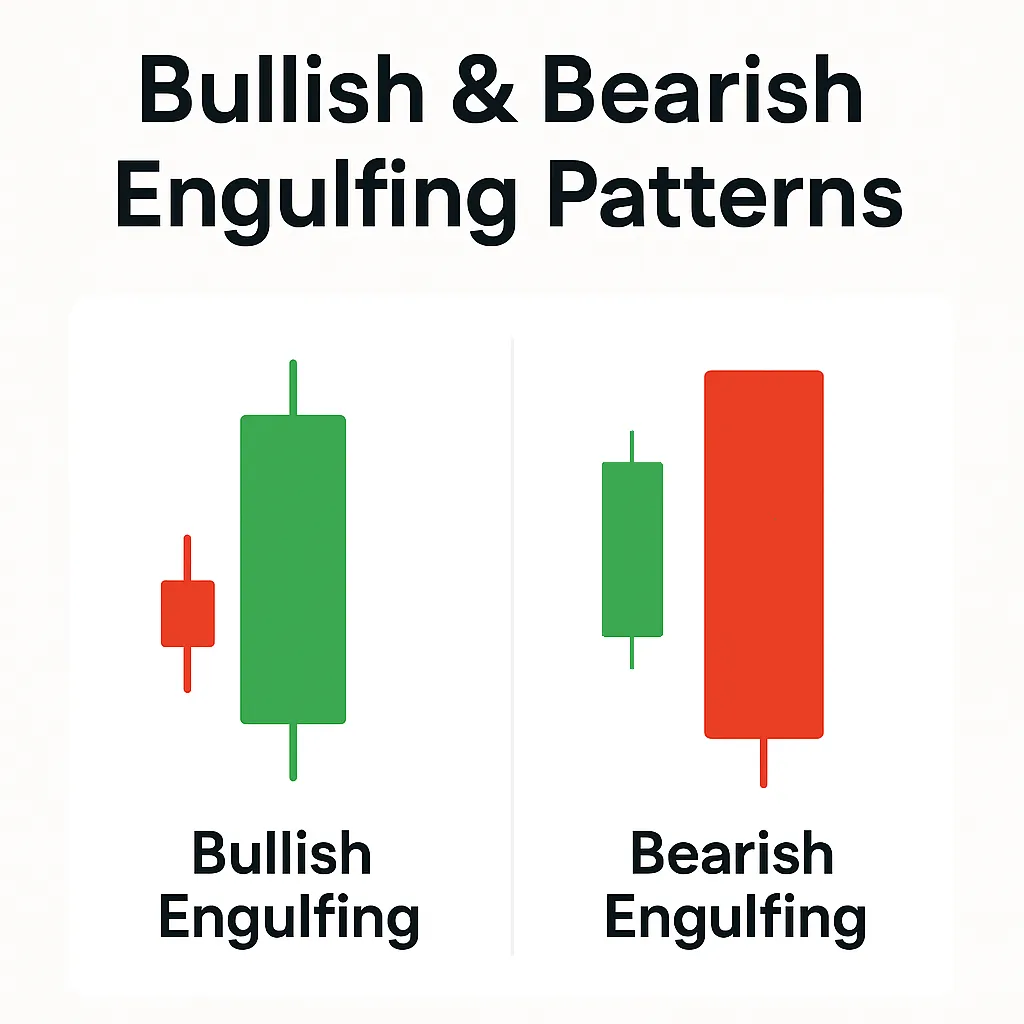
Engulfing Pattern is a powerful reversal pattern consisting of two candlesticks. It indicates a sharp change in market sentiment, when one candlestick completely “engulfs” the previous one, demonstrating the dominance of one side (buyers or sellers).
- Bullish Engulfing: Forms after a downtrend. The first candlestick is a small red (bearish) candlestick, followed by a large green (bullish) candlestick whose body completely covers the body of the previous red candlestick. This is a strong bullish signal indicating that buyers have taken control of the market and are ready to push the price upward.
- Bearish Engulfing: Forms after an uptrend. The first candlestick is a small green (bullish) candlestick, followed by a large red (bearish) candlestick whose body completely covers the body of the previous green candlestick. This is a strong bearish signal indicating that sellers have taken control of the market and are ready to push the price downward.
The Engulfing pattern is considered one of the most reliable reversal signals, especially if it is accompanied by an increase in trading volume.
Morning Star and Evening Star: Powerful Reversal Signals
Morning Star and Evening Star are three-candlestick reversal patterns that are among the most reliable signals of a trend change. They demonstrate a gradual weakening of the current trend and a shift of initiative to the opposite side.
- Morning Star: A bullish reversal pattern that appears after a downtrend. It consists of:
- A large red candlestick confirming the downtrend.
- A small candlestick (can be a Doji, Hammer, or any other with a short body) that opens with a gap down and indicates indecision.
- A large green candlestick that opens with a gap up and closes significantly above the midpoint of the first red candlestick. This candlestick confirms the reversal and the dominance of buyers.
- Evening Star: A bearish reversal pattern that appears after an uptrend. It consists of:
- A large green candlestick confirming the uptrend.
- A small candlestick (can be a Doji, Hanging Man, or any other with a short body) that opens with a gap up and indicates indecision.
- A large red candlestick that opens with a gap down and closes significantly below the midpoint of the first green candlestick. This candlestick confirms the reversal and the dominance of sellers.
These patterns are strong signals because they show not only a change in direction but also the struggle that preceded this change.
How to Recognize Patterns on the Pocket Option Platform
Recognizing Candlestick patterns on the Pocket Option platform requires practice and attentiveness. Here are some tips:
- Use different timeframes: Patterns that seem insignificant on short timeframes can be very meaningful on longer ones. Switch between 15-minute, 1-hour, and 4-hour charts to see the bigger picture.
- Adjust the color scheme: Make sure your color scheme clearly distinguishes bullish and bearish candlesticks — this will help you identify patterns more quickly.
- Use drawing tools: Pocket Option provides tools for drawing trend lines and marking support and resistance levels. Patterns forming near these levels are often more reliable.
- Practice on a demo account: Look for these patterns on live charts. Mark them, analyze how the price behaved before and after they appeared. This is the best way to develop an “eye” for pattern recognition.
- Don’t trade every pattern: Not all patterns are equally reliable. Focus on the strongest and most common ones, such as Engulfing, Hammer, Hanging Man, Morning Star, and Evening Star. Always look for confirmation from other indicators or subsequent candlesticks.
Mastering these key Candlestick patterns is the foundation for more advanced Candlestick chart analysis and the development of an effective Candlestick chart trading strategy.
- Advanced Candlestick Patterns: Multi-Candlestick Combinations
In addition to single candlestick patterns, there are more complex combinations of two, three, or more candlesticks that provide even stronger and more reliable signals about potential market movements. These Candlestick patterns often indicate the strengthening of the current trend, its reversal, or continuation. Understanding these advanced patterns will significantly deepen your Candlestick chart analysis and allow you to make more informed trading decisions.
Double and Triple Patterns: Strengthening the Signal
Many patterns are formed by a combination of two or three candlesticks, which gives them greater significance compared to single candlesticks. These patterns reflect a longer period of struggle between buyers and sellers, and their formation often signals a more confident shift in market sentiment.
Two-Candlestick Patterns
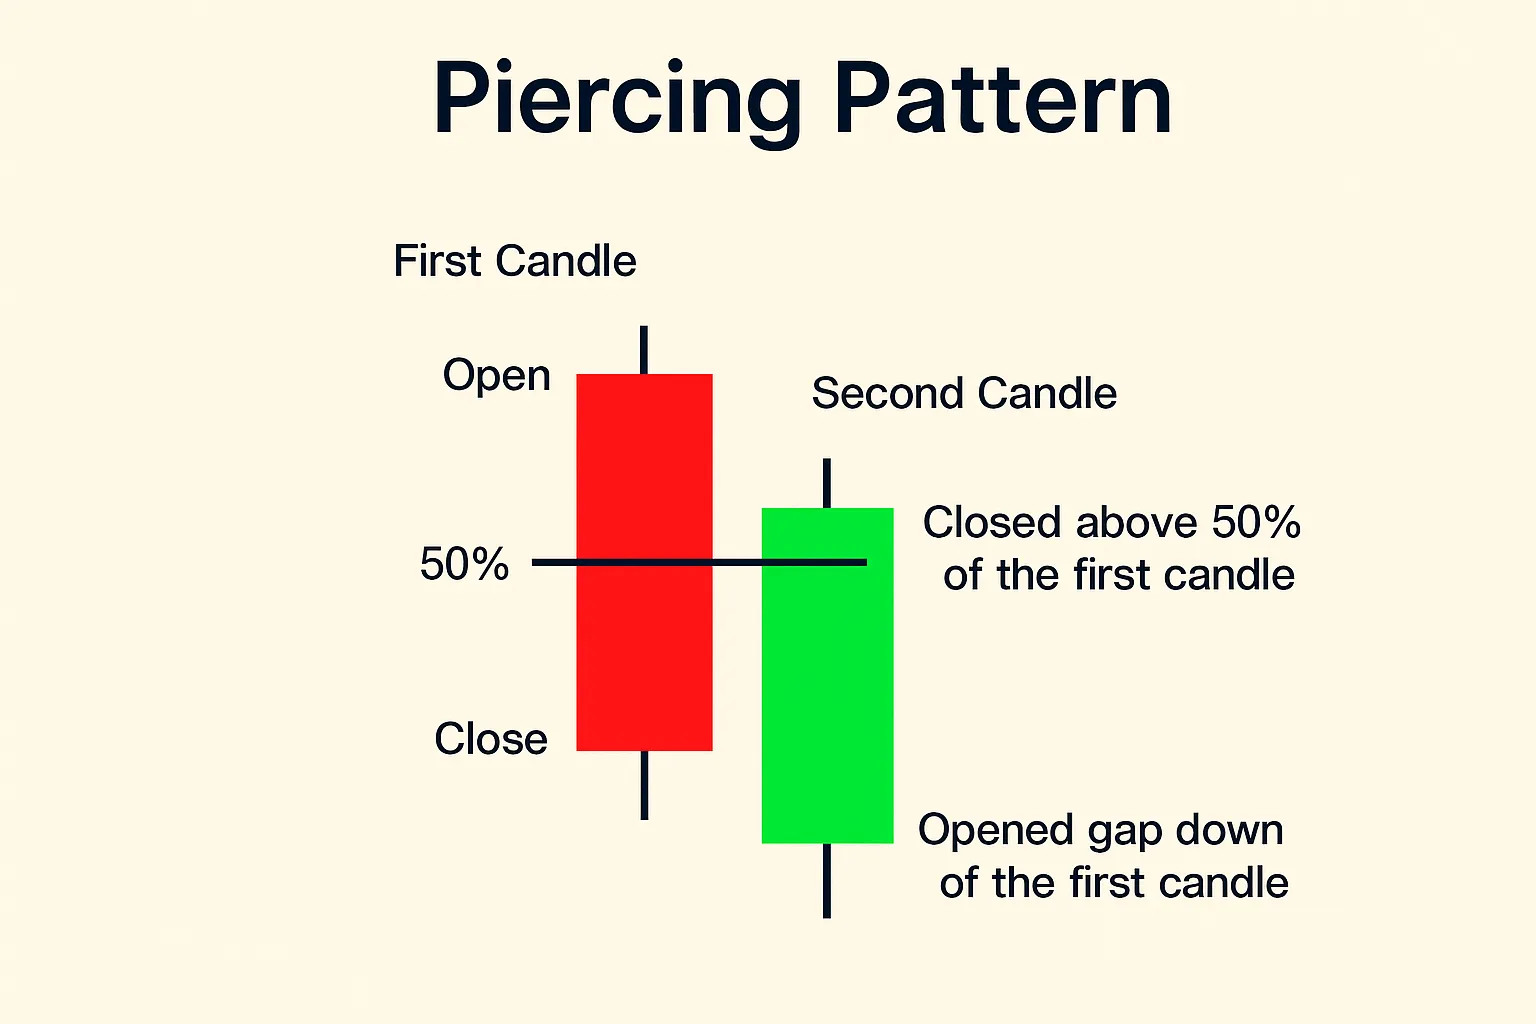
- Piercing Line: A bullish reversal pattern that appears after a downtrend. The first candlestick is a long red one, followed by a green candlestick that opens below the red candlestick’s low but closes above its midpoint. This indicates that buyers managed to reclaim a significant portion of lost ground.
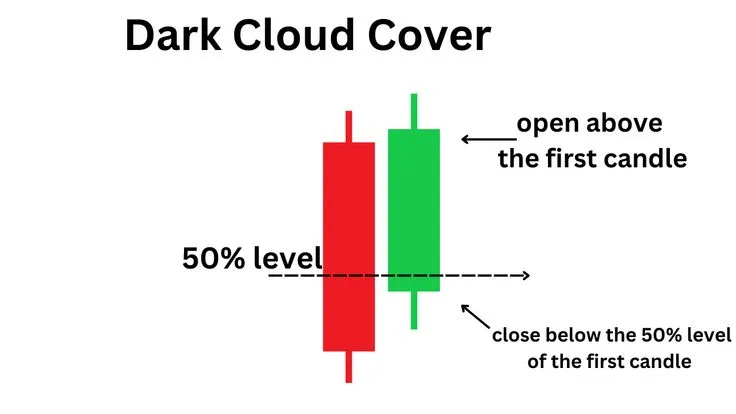
- Dark Cloud Cover: A bearish reversal pattern that appears after an uptrend. The first candlestick is a long green one, followed by a red candlestick that opens above the high of the green candlestick but closes below its midpoint. This indicates that sellers have taken the initiative.
Harami: Will be examined in detail below.
Three-Candlestick Patterns
- Three White Soldiers: Will be examined in detail below.
- Three Black Crows: Will be examined in detail below.
- Morning Star and Evening Star: Already covered in the previous chapter, but they are vivid examples of three-candlestick patterns.
These combinations, especially when they appear near key support or resistance levels, provide more reliable signals for Trading with candlestick charts.
Harami: The Opposite of the Engulfing Pattern
Harami is a two-candlestick pattern that is the opposite of the Engulfing pattern. In Japanese, “harami” means “pregnant.” This pattern indicates a weakening of the current trend and a potential reversal.
- Bullish Harami: Forms after a downtrend. The first candlestick is a long red (bearish) one, followed by a small green (bullish) candlestick whose body is completely contained within the body of the previous red candlestick. This indicates that the downward movement is slowing and buyers are starting to become active.
- Bearish Harami: Forms after an uptrend. The first candlestick is a long green (bullish) one, followed by a small red (bearish) candlestick whose body is completely contained within the body of the previous green candlestick. This indicates that the upward movement is slowing and sellers are starting to become active.
The Harami is a less powerful reversal signal than the Engulfing pattern and often requires confirmation from the next candlestick or other indicators. However, its appearance always signals the need for increased market attention.
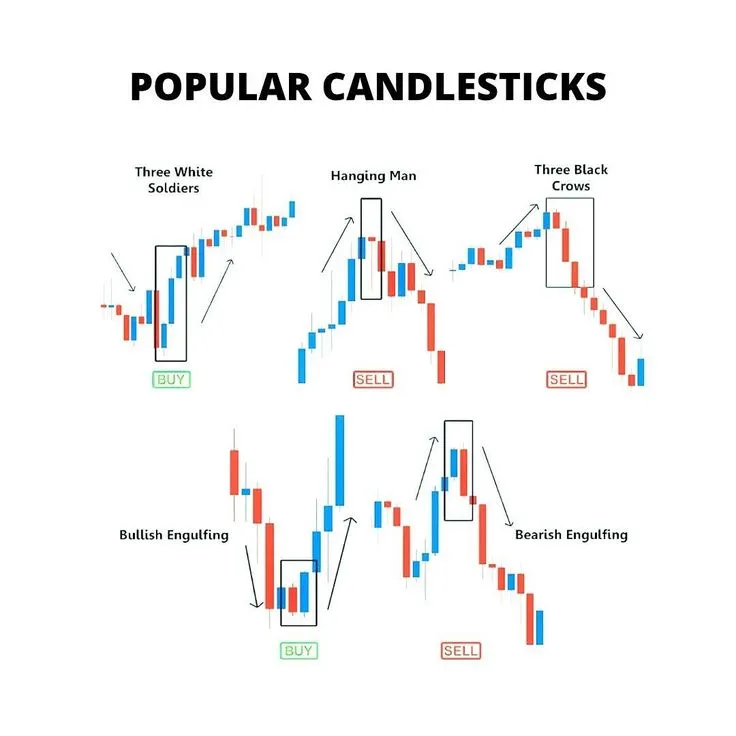
Three White Soldiers and Three Black Crows: Strong Trend Signals
These patterns are powerful indicators of trend continuation and often signal strong and sustained price movement.
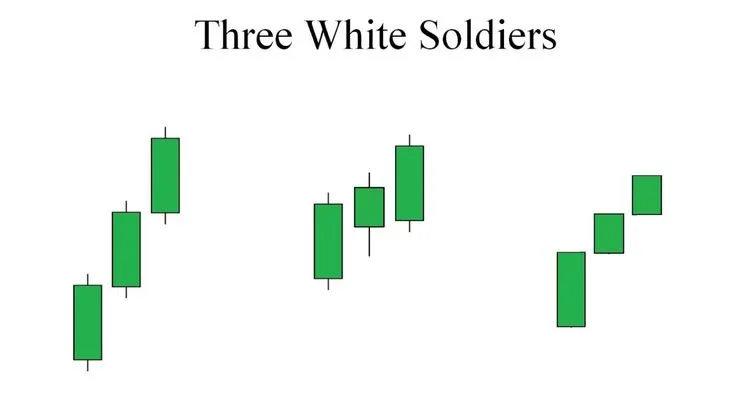
- Three White Soldiers: A strong bullish pattern consisting of three consecutive long green candlesticks. Each candlestick opens within the body of the previous one and closes above its high. This pattern indicates strong and sustained buying pressure, signaling the start or continuation of an uptrend. The appearance of this pattern after a downtrend is a very strong reversal signal.
- Three Black Crows: A strong bearish pattern consisting of three consecutive long red candlesticks. Each candlestick opens within the body of the previous one and closes below its low. This pattern indicates strong and sustained selling pressure, signaling the start or continuation of a downtrend. The appearance of this pattern after an uptrend is a very strong reversal signal.
These patterns are especially reliable when they form after a period of consolidation or correction, confirming the resumption of the main trend.
Gap: The Significance of Price Gaps
A Gap occurs when the opening price of the current candlestick is significantly different from the closing price of the previous candlestick, leaving an empty space on the chart. Gaps can occur for various reasons, including important news, changes in market sentiment, or high volatility. They are important signals and can indicate the strength of a trend or potential support/resistance levels.
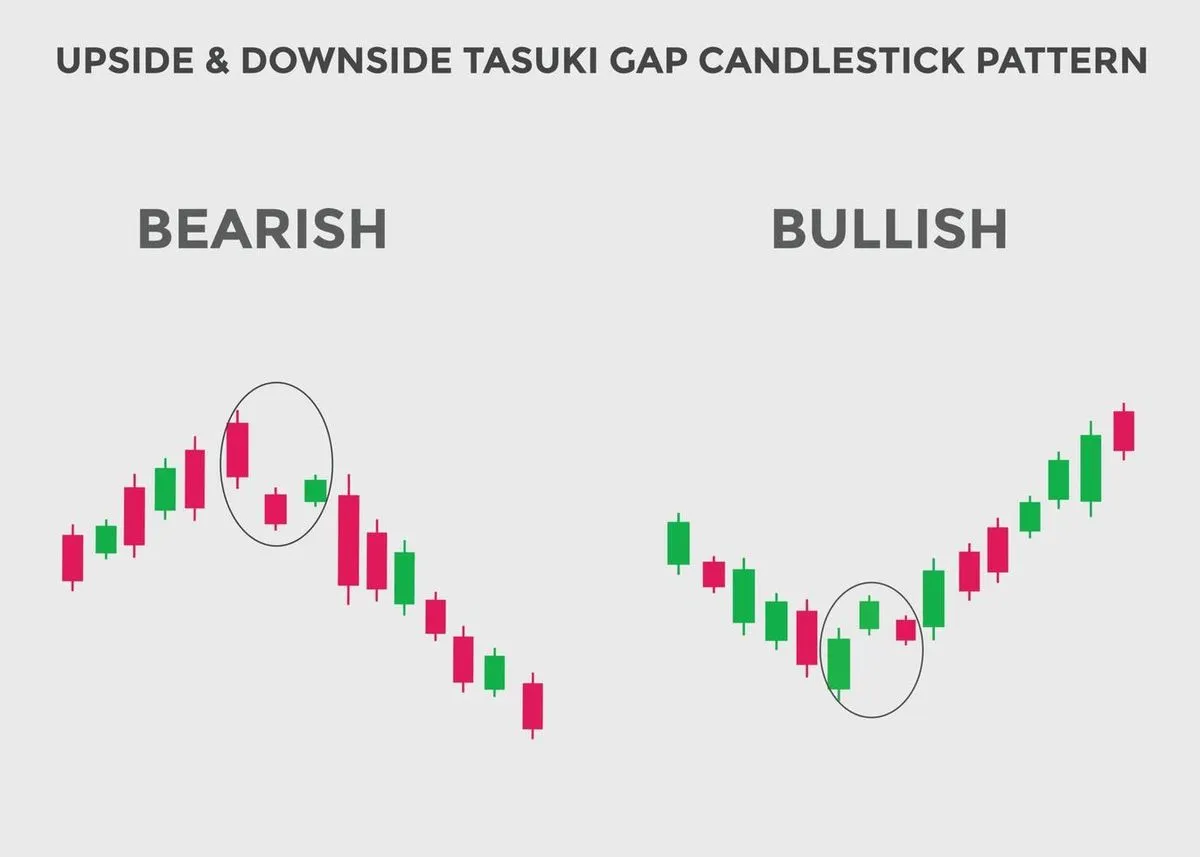
- Gap Up: The opening price of the current candlestick is above the high of the previous one. It usually indicates strong bullish sentiment and buying pressure.
- Gap Down: The opening price of the current candlestick is below the low of the previous one. It usually indicates strong bearish sentiment and selling pressure.
Gaps often act as support or resistance levels. For example, a gap up can become a strong support level, while a gap down can act as a resistance level. It is important to observe how the price reacts to these levels. Sometimes gaps “close” (the price returns to the gap level), while other times they remain open, confirming the strength of the trend.
Practical Examples on Real Pocket Option Charts
The best way to master these advanced Candlestick patterns is to practice recognizing them on real charts. The Pocket Option platform provides excellent opportunities for this:
- Use historical data: On Pocket Option, you can view historical data for various assets. Open the charts and scroll back to find examples of Harami, Three White Soldiers, Three Black Crows, and gaps. Analyze how the price behaved after their appearance.
- Practice on a demo account: Try to predict the price movement after these patterns form and compare your forecasts with the actual result. This will help you develop intuition and confidence.
- Combine with other tools: Remember that candlestick patterns are most reliable when confirmed by other technical analysis tools. For example, if a reversal pattern appears near a strong resistance level or the RSI indicator shows overbought conditions, this strengthens the signal.
- Keep a trading journal: Record all the patterns you find, your forecasts, and the results. This will help you track your progress, identify strengths and weaknesses in pattern recognition, and improve your Candlestick chart trading strategy.
Mastering advanced Candlestick patterns is an important step toward becoming a professional trader. They allow you to better understand market dynamics and make more accurate decisions when Trading with candlestick charts.
Best Candlestick Patterns for Trading: Choosing the Most Effective Patterns
The world of Candlestick patterns is vast, and there are many different formations, each carrying specific information about the market. However, not all patterns are equally reliable and effective for trading. The purpose of this chapter is to help you choose the Best candlestick patterns for trading that have proven their effectiveness in practice and to understand the criteria for their reliability. We will also look at which patterns are best suited for bullish and bearish markets, as well as for identifying trend continuation.
Criteria for the Reliability of Candlestick Patterns
Before moving on to specific patterns, it is important to understand what makes a candlestick pattern reliable. You should not trade every pattern you see. Consider the following criteria:
- Market context: A pattern that appears at the end of a long trend is much more reliable than one formed in the middle of a sideways movement. Reversal patterns are strongest when they appear after a significant price movement.
- Trading volume: An increase in trading volume during the formation of a pattern significantly increases its reliability. High volume confirms that a large number of market participants are behind the price movement.
- Support and resistance levels: Patterns forming near key support or resistance levels, as well as trend lines, are more reliable. These levels act as magnets for price and are often reversal points.
- Candle size: The larger the body of the candlestick in the pattern (especially in Engulfing or Three Soldiers/Crows), the stronger the signal. Long bodies indicate decisiveness from buyers or sellers.
- Shadow length: Long shadows in patterns such as Hammer or Hanging Man indicate strong price rejection at certain levels, which is an important signal.
- Confirmation: Always look for confirmation from the next candlestick or other indicators. For example, a bullish reversal pattern becomes more reliable if the next candlestick closes above its high.
- Timeframe: Patterns on longer timeframes (daily, weekly) are usually more reliable than on shorter ones (minute charts), as they contain more information and are less affected by market noise.
Top 5 Patterns for a Bullish Market
These patterns often signal potential upward movement or continuation of a bullish trend:
- Bullish Engulfing: A powerful reversal pattern consisting of a small bearish candlestick completely engulfed by a large bullish candlestick. Indicates that buyers have taken control.
- Hammer: A bullish reversal pattern appearing after a downtrend. Small body, long lower shadow. Signals buying pressure.
- Morning Star: A three-candlestick bullish reversal pattern. Consists of a large bearish candlestick, a small indecision candlestick (often a Doji), and a large bullish candlestick. Indicates a shift in sentiment.
- Piercing Line: A two-candlestick bullish reversal pattern. The first candlestick is a long bearish one, the second is bullish, opening below the low of the first and closing above its midpoint.
- Three White Soldiers: A strong bullish continuation pattern. Three consecutive long bullish candlesticks, each opening within the body of the previous one and closing above its high.
Top 5 Patterns for a Bearish Market
These patterns often signal potential downward movement or continuation of a bearish trend:
- Bearish Engulfing: A powerful reversal pattern consisting of a small bullish candlestick completely engulfed by a large bearish candlestick. Indicates that sellers have taken control.
- Hanging Man: A bearish reversal pattern appearing after an uptrend. Small body, long lower shadow. Signals selling pressure.
- Evening Star: A three-candlestick bearish reversal pattern. Consists of a large bullish candlestick, a small indecision candlestick (often a Doji), and a large bearish candlestick. Indicates a shift in sentiment.
- Dark Cloud Cover: A two-candlestick bearish reversal pattern. The first candlestick is a long bullish one, the second is bearish, opening above the high of the first and closing below its midpoint.
- Three Black Crows: A strong bearish continuation pattern. Three consecutive long bearish candlesticks, each opening within the body of the previous one and closing below its low.
Patterns for Identifying Trend Continuation
Not all patterns signal a reversal. Some indicate that the current trend is likely to continue after a brief pause or consolidation:
- Three White Soldiers and Three Black Crows: As already mentioned, these patterns are strong trend continuation signals, especially when they appear after a correction.
- Rising Three Methods / Falling Three Methods: These are five-candlestick trend continuation patterns. In the bullish version (Rising Three Methods), after a long bullish candlestick, three small bearish candlesticks follow, remaining within the range of the first bullish candlestick, then another long bullish candlestick closes above the high of the first. This indicates a temporary pause in the uptrend before it continues. The bearish version (Falling Three Methods) is the mirror image.
- Gap: Gaps that do not close within several candlesticks often indicate strong trend continuation in the direction of the gap.
How to Choose Patterns for Your Trading Style
Choosing Candlestick Patterns for Your Trading Strategy
The selection of Candlestick patterns for your trading strategy should be based on your trading style and preferences:
- For short-term trading (scalping, day trading): Focus on patterns that provide quick and clear reversal or continuation signals on short timeframes (e.g., 5-minute or 15-minute). These can include the Hammer, Hanging Man, and Engulfing. However, keep in mind the increased market noise on these timeframes.
- For medium-term trading (swing trading): Use patterns on longer timeframes (1-hour, 4-hour, daily). Morning Star/Evening Star, Three Methods, as well as Engulfing and Hammer/Hanging Man with greater weight work well here. These patterns provide more reliable signals.
- For long-term trading (investing): Focus on patterns on daily, weekly, and monthly charts. Large reversal formations and trend continuation patterns that confirm long-term moves are important here. Gaps can also be significant.
Remember that Candlestick patterns meaning always depends on context and should be used in combination with other Candlestick chart analysis tools.
Market Psychology Through the Lens of Candlestick Charts
Candlestick charts are not just a collection of prices; they are a mirror reflecting the collective psychology of market participants. Each candlestick, each pattern, is the result of a battle between fear and greed, optimism and pessimism, buyers and sellers. Understanding these psychological aspects allows a trader not only to read price movements but also to anticipate them based on the market’s emotional state. This deep understanding is one of the key advantages of Candlestick chart analysis.
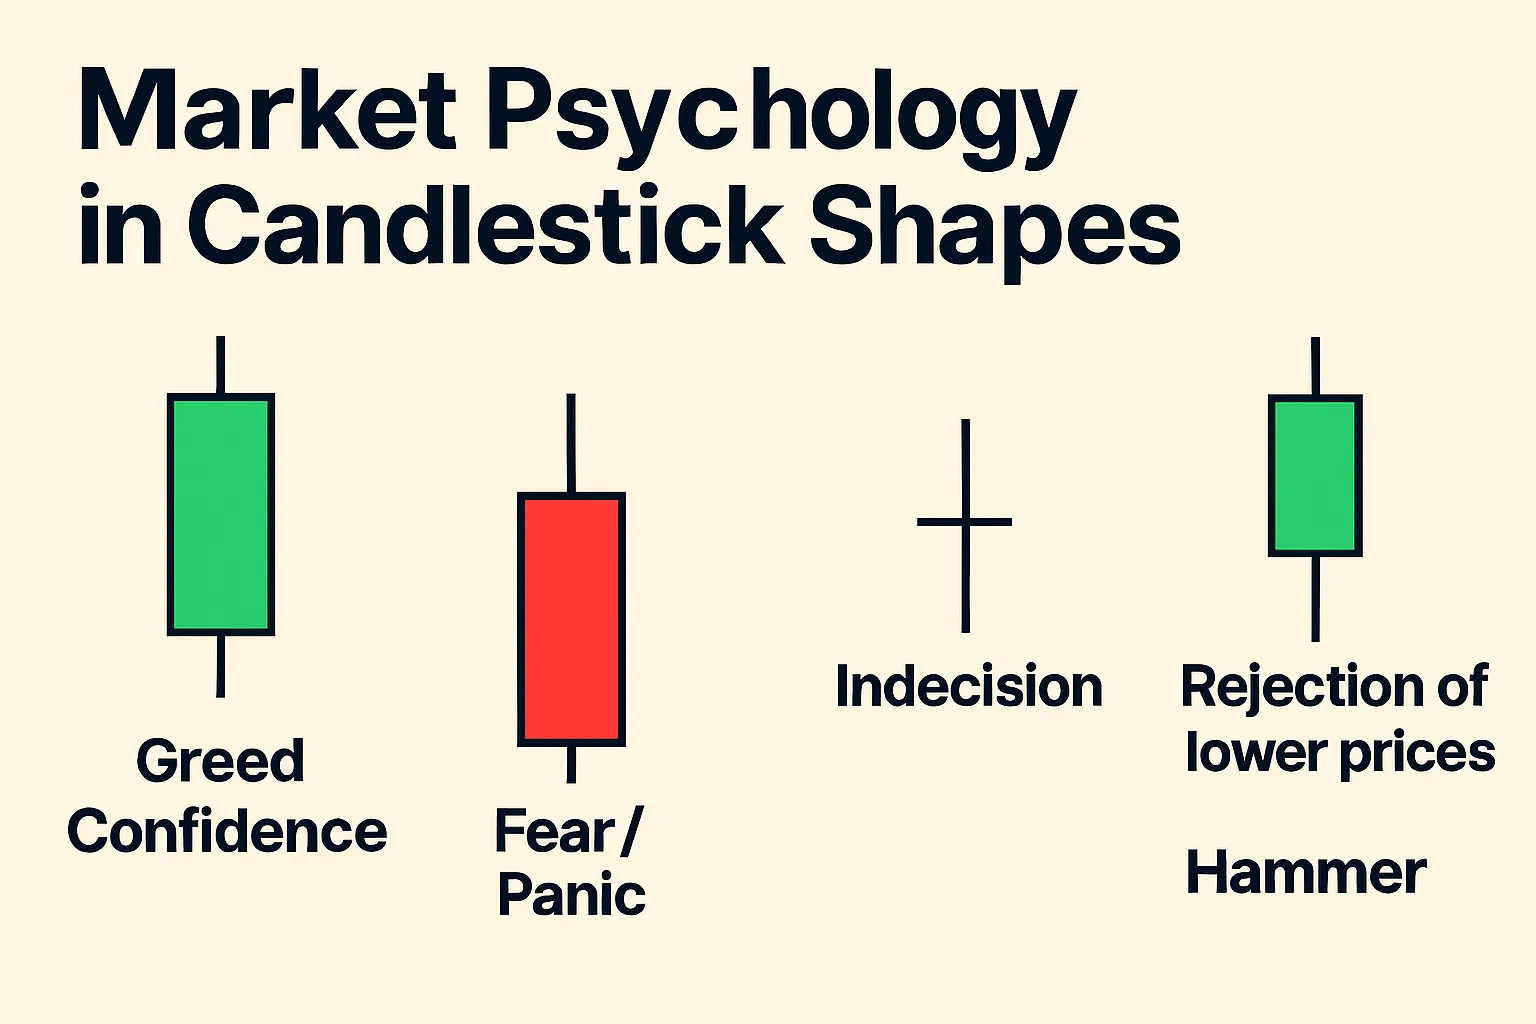
How Candlesticks Reflect Market Participants’ Emotions
The shape and size of a candlestick, as well as the length of its shadows, are directly related to traders’ emotions and actions:
- Long bullish candlesticks (green): Reflect strong optimism and buyer greed. They show that buyers dominate the market, actively pushing the price up, while sellers offer minimal resistance. This is a period of euphoria for the bulls.
- Long bearish candlesticks (red): Indicate prevailing fear and panic among sellers. Sellers aggressively push the price down, and buyers are unable to stop the decline. This is a period of despair for the bulls.
- Short-bodied candlesticks (Doji, Spinning Tops): Signal uncertainty and indecision. Neither buyers nor sellers can gain control, and the market is in balance. This may be a sign of trend exhaustion or a consolidation period before the next move.
- Long shadows: Show that the price deviated significantly from the opening/closing levels but was then pushed back in the opposite direction. A long upper shadow indicates that buyers tried to raise the price but met strong seller resistance (fear). A long lower shadow shows that sellers tried to push the price down but faced strong buyer support (greed).
Thus, candlesticks visualize supply and demand dynamics, allowing a trader to feel the market’s pulse.
Fear and Greed: Visual Indicators
Fear and greed are the two main emotions driving the market. Candlestick charts clearly display their manifestations:
- Greed: Seen in long bullish candlesticks, especially when they form consecutively, creating patterns like Three White Soldiers. This indicates strong buying desire, often driven by FOMO (fear of missing out). Traders consumed by greed may ignore risks and buy at market peaks.
- Fear: Visualized in long bearish candlesticks, especially in Three Black Crows patterns or in sharp declines after patterns like Hanging Man or Evening Star. Fear causes traders to panic-sell, often at the market bottom, to avoid further losses.
Engulfing patterns are also a vivid example of changing dominant emotion:
- Bullish Engulfing shows how buyer greed overcomes fear.
- Bearish Engulfing shows how seller fear suppresses buyer greed.
Identifying Moments of Panic and Euphoria
Candlestick charts make it possible to identify moments of extreme panic and euphoria, which often precede reversals:
- Panic: Often appears as bearish gaps, long red candlesticks with high volumes, or patterns such as Three Black Crows after a prolonged downtrend. At the bottom of panic, reversal patterns like Hammer or Morning Star often form, as buyers start entering the market after an excessive drop.
- Euphoria: Visualized as bullish gaps, long green candlesticks, or patterns like Three White Soldiers after a prolonged uptrend. At the peak of euphoria, reversal patterns like Hanging Man or Evening Star often appear, as sellers begin taking profits or opening short positions.
Recognizing these extreme emotional states helps a trader avoid following the crowd and make counter-trend decisions when justified.
Psychological Aspects of Pattern Formation
Every Candlestick pattern has an underlying psychological basis:
- Doji: Reflects balance between buyers and sellers, when neither side can gain control. This indecision often precedes a major move, as the market “decides” where to go next.
- Hammer / Hanging Man: Show that one side (sellers for Hammer, buyers for Hanging Man) tried to push the price in their favor but met strong resistance and was rejected. The long shadow symbolizes price rejection at a certain level, indicating the market’s psychological readiness for a reversal.
- Engulfing: Demonstrates a sharp change in sentiment. The small candlestick shows the previous trend losing strength, while the large engulfing candlestick shows the opposite side taking full control, completely suppressing the prior move. This is a psychological “break” in the market.
Understanding these psychological drivers behind pattern formation greatly improves a trader’s ability in How to read candlestick charts and predict their implications.
How to Use Psychological Understanding to Predict Movements
Integrating the psychological aspect into your Candlestick chart analysis allows you to:
- Avoid false signals: If a reversal pattern appears during strong euphoria or panic but without volume confirmation or at key levels, its reliability decreases. Understanding psychology helps filter out noise.
- Trade against the crowd: During moments of extreme panic or euphoria, most traders act irrationally. An experienced trader who understands market psychology can use these moments to enter counter-trend trades when the crowd is at peak fear or greed.
- Improve risk management: Knowing that the market moves on emotions helps traders maintain discipline and stick to their trading plan without succumbing to panic or overconfidence. This is crucial for building psychological resilience.
- Anticipate reversals: When you see candlesticks showing indecision (Doji) after a long trend, or patterns indicating exhaustion (Hammer, Hanging Man), it can be an early signal to prepare for a reversal, allowing you to take a favorable position.
Studying market psychology through the lens of candlestick charts is not just an academic exercise but a practical skill that significantly increases the effectiveness of your Candlestick chart trading strategy and helps you make more informed decisions when Trading with candlestick charts.
Candlestick Chart Trading Strategy: Developing a Trading System
Effective use of candlestick charts in trading goes beyond simply recognizing patterns. True mastery lies in developing a comprehensive Candlestick chart trading strategy that integrates candlestick analysis with other tools, entry and exit rules, and strict risk management. In this chapter, we will examine the key components of such a strategy, as well as ways to test and optimize it on the Pocket Option platform.
Components of an Effective Candlestick Strategy
A well-designed trading strategy based on candlestick analysis should include the following elements:
- Choosing assets and timeframes: Determine which financial instruments (currency pairs, stocks, cryptocurrencies) and which time intervals (15-minute, hourly, daily) you will trade. This depends on your trading style (scalping, day trading, swing trading).
- Core patterns: Select several of the most reliable Candlestick patterns (e.g., Engulfing, Hammer, Morning Star/Evening Star) that you will use as primary signals. Do not try to memorize all patterns — focus on those that best match your style and show high efficiency on your chosen assets and timeframes.
- Additional confirmation tools: Candlestick patterns are rarely used in isolation. Always look for confirmation from other technical analysis tools, such as:
- Support and resistance levels: Reversal patterns forming at strong levels are much more reliable.
- Trend lines and channels: Help determine the overall market direction and potential reversal points.
- Indicators: Moving Averages, RSI, MACD, Stochastic can confirm candlestick signals, indicating overbought/oversold conditions or a shift in momentum.
- Entry rules: Clearly define the conditions under which you will open a trade. For example: “Open a buy if a bullish Engulfing pattern forms at a support level and RSI exits the oversold zone.”
- Exit rules (take-profit and stop-loss): These are critically important elements that protect your capital and lock in profits.
- Capital management: Determine what percentage of your deposit you are willing to risk in a single trade. This will help avoid major losses.
Integrating Candlestick Analysis with Other Indicators
The power of Candlestick chart analysis increases significantly when integrated with other tools. Examples include:
- Candlesticks + Moving Averages: Use moving averages to determine the overall trend. If the price is above the moving average and a bullish pattern forms, it strengthens the buy signal. If the price breaks below the moving average and a bearish pattern forms, it is a sell signal.
- Candlesticks + RSI (Relative Strength Index): RSI helps identify overbought or oversold conditions. A bullish pattern forming when RSI is in the oversold zone (below 30) is a strong buy signal. Similarly, a bearish pattern in the overbought zone (above 70) is a sell signal.
- Candlesticks + Fibonacci Levels: Candlestick patterns forming at key Fibonacci retracement levels are often very reliable reversal or trend continuation signals.
- Candlesticks + Volume: An increase in trading volume during the formation of a candlestick pattern confirms its strength. For example, a bullish Engulfing with high volume is much more reliable than the same pattern with low volume.
On the Pocket Option platform, you can easily add various indicators to the chart and adjust their parameters, allowing you to create unique combinations for your Candlestick chart trading strategy.
Entry and Exit Rules Based on Candlestick Patterns
Clear entry and exit rules form the foundation of any successful trading system:
Entry Rules:
- Pattern confirmation: Do not enter a trade immediately after a pattern forms. Wait for confirmation from the next candlestick. For example, after a Hammer forms, the next candlestick should close above the Hammer’s high to confirm a bullish reversal.
- Breakout entry: For some patterns (e.g., Engulfing), you can enter a trade on a breakout of the pattern’s high (bullish) or low (bearish).
- Pullback entry: After a strong reversal pattern forms, the price often makes a small pullback. You can wait for this pullback and enter at a better price.
Exit Rules (Take-Profit):
- Support/resistance levels: Set take-profit at the nearest strong support level (for short positions) or resistance level (for long positions).
- Fixed risk/reward: Define your desired risk/reward ratio (e.g., 1:2 or 1:3) and set take-profit accordingly.
- Reversal patterns: If an opposite reversal pattern appears on the chart, it may be a signal to lock in profits.
Exit Rules (Stop-Loss):
- Beyond the pattern: For reversal patterns, stop-loss is usually set beyond the pattern’s extreme. For example, for a Hammer, place the stop-loss below its lower shadow.
- Beyond the level: If a pattern forms at a support/resistance level, a stop-loss can be placed just beyond that level.
Risk Management in Candlestick Strategies
Risk management is the cornerstone of successful trading. Without it, even the most profitable Candlestick chart trading strategy can lead to a blown account. Key aspects:
- Position size: Never risk more than 1–2% of your trading capital on a single trade.
- Risk/reward ratio: Always aim for potential profit at least 2–3 times greater than potential loss.
- Using stop-losses: Stop-loss is your insurance policy. It closes a trade automatically if the price moves against you, limiting losses. Never trade without a stop-loss.
- Diversification: Do not rely on a single pattern or a single asset. Diversify your signals and assets to reduce overall risk.
Testing and Optimizing the Strategy on Pocket Option
Before using your Candlestick chart trading strategy on a live account, it must be thoroughly tested and optimized:
- Backtesting: Review historical data on Pocket Option charts and manually apply your strategy. Mark all entry and exit points and record results (profit/loss, risk/reward).
- Forward testing on a demo account: After backtesting, move to live market conditions on the Pocket Option demo account without financial risk. Monitor your emotions and discipline.
- Optimization: Based on test results, adjust your strategy. You may need to change indicator parameters or entry/exit rules. The goal is to maximize profit and minimize loss.
- Trading journal: Keep a detailed journal of every trade, including date, time, asset, timeframe, pattern, reason for entry, entry point, and result. Analyze mistakes and successes to continually improve your strategy.
Developing and testing a Candlestick chart trading strategy is an ongoing process. The market constantly changes, and your strategy should adapt to these changes. Continuous learning and practice, especially on a demo account, are the keys to long-term success in Trading with candlestick charts.
Candlestick Analysis for Different Timeframes
One of the key advantages of the Candlestick Trading Chart is its versatility and applicability to any time intervals, or timeframes. Choosing the right timeframe is critical for successful trading, as it determines the nature of price movement, the number of signals, and the level of market noise. Understanding the features of candlestick analysis across different timeframes and applying multi-timeframe analysis can significantly improve the effectiveness of your Candlestick chart trading strategy.
Features of Candlestick Analysis on Short Timeframes
Short timeframes (e.g., 1-minute, 5-minute, 15-minute) are mainly used for scalping and high-frequency trading. On these intervals, each candlestick represents a very short period of time, leading to the following characteristics:
- High volatility and noise: Short timeframes have many random price fluctuations that can create false signals. This requires quick reaction and high concentration from the trader.
- Frequent signals: Patterns form very often, providing many opportunities to enter trades. However, not all of them will be reliable.
- Fast execution: Trades on short timeframes are usually opened and closed within minutes, allowing you to quickly lock in small profits.
- Discipline requirement: Due to the high frequency of signals and noise, trading short timeframes demands strict discipline, clear risk management, and the ability to make quick decisions.
When using short timeframes, always confirm candlestick signals with longer timeframes and use additional indicators to filter noise.
Medium-Term Analysis: Hourly and 4-Hour Charts
Medium-term timeframes (1-hour, 4-hour) are the sweet spot for many day traders and swing traders. They offer a balance between detail and signal reliability:
- Less noise: Compared to short timeframes, 1-hour and 4-hour charts contain less market noise, making patterns more reliable.
- Clearer trends: Trends on these timeframes are more stable and easier to identify.
- Sufficient signals: The number of trading signals remains adequate for active trading, but they appear less frequently than on minute charts, giving the trader more time for analysis.
- Suitable for day and swing trading: These timeframes allow trades to last from several hours to several days, convenient for those who cannot monitor the market constantly.
Candlestick patterns such as Engulfing, Morning/Evening Star, Hammer, and Hanging Man on these timeframes tend to have a higher probability of success.
Long-Term Analysis: Daily and Weekly Candles
Long-term timeframes (daily, weekly, monthly) are used to identify major trends and for strategic planning. They are ideal for swing traders and long-term investors:
- Maximum reliability: Patterns on daily and weekly charts are the most reliable as they aggregate large amounts of price data and reflect fundamental market shifts.
- Minimal noise: Market noise on these timeframes is almost nonexistent, allowing focus on major moves.
- Rare signals: Trading signals appear far less often, but they are generally very strong and indicate significant trend changes.
- Suitable for long-term investments: Allow you to hold positions for weeks or months without constant monitoring.
When analyzing long-term charts, focus on major reversal patterns and trend continuation formations that may indicate a change in the global market direction.
Multi-Timeframe Analysis: Signal Alignment
Multi-timeframe analysis is a powerful technique that involves analyzing the same asset across multiple timeframes (usually three: long-term, medium-term, and short-term) simultaneously. The goal is to find alignment of signals and confirm trade ideas. This greatly increases the reliability of your Candlestick chart trading strategy.
Example of multi-timeframe analysis:
- Identify the global trend: Start with the longest timeframe (e.g., daily or weekly) to determine the main trend. Always trade in the direction of the global trend.
- Find entry/exit points: Move to the medium-term timeframe (e.g., 4-hour or 1-hour) to locate key support/resistance levels and candlestick patterns that confirm the global trend.
- Fine-tune the entry: Use a short timeframe (e.g., 15-minute or 5-minute) to pinpoint the exact entry when candlestick patterns on this timeframe confirm signals from longer intervals.
If all three timeframes point in the same direction, the probability of a successful trade increases significantly. For example, if the daily chart shows an uptrend, the 4-hour chart forms a bullish Engulfing pattern at support, and the 15-minute chart shows a Hammer, this is a very strong buy signal.
Choosing the Optimal Timeframe on Pocket Option
The Pocket Option platform offers broad capabilities for working with different timeframes, making it ideal for multi-timeframe analysis. To choose the optimal timeframe for your Candlestick chart trading strategy:
- Identify your trading style: Are you a scalper, day trader, or swing trader? Your trading style directly affects the choice of timeframe.
- Start with longer timeframes: Even if you plan to trade on short intervals, always begin your analysis with the daily or 4-hour chart to understand the overall market picture.
- Use the timeframe switching function: On Pocket Option, it’s easy to switch between different timeframes, enabling quick multi-timeframe analysis.
- Practice on a demo account: Experiment with different timeframes to see which feels most comfortable and yields the best results. Observe how signal characteristics change across intervals.
- Combine with indicators: Indicators such as moving averages or RSI can help confirm trends and signals on your chosen timeframe.
Understanding and correctly applying candlestick analysis across different timeframes is a key element in developing your skills for Trading with candlestick charts and increasing the profitability of your trades on Pocket Option.
Unique Features of Pocket Option for Candlestick Analysis
The choice of trading platform plays a crucial role in the effectiveness of applying Candlestick chart analysis. Pocket Option not only provides the ability to plot candlestick charts but also offers a range of unique features and tools that greatly simplify and enhance the analysis process, making it one of the best platforms for Trading with candlestick charts. In this chapter, we will examine why Pocket Option is the ideal choice for traders using candlestick analysis.
Exclusive Platform Tools for Working with Candlesticks
Pocket Option is constantly evolving, offering traders innovative solutions. In addition to standard candlestick chart settings, the platform provides:
- Customizable indicators and oscillators: A wide selection of built-in technical indicators (such as Moving Averages, RSI, MACD, Bollinger Bands) and oscillators that can be easily overlaid on candlestick charts. This allows traders to combine candlestick analysis with other methods for more accurate signals.
- Drawing tools: The platform is equipped with a full set of drawing tools (trend lines, horizontal and vertical lines, channels). These tools are critically important for identifying key support and resistance levels, as well as for visualizing trends, which enhances the effectiveness of Candlestick chart analysis.
- Various chart types: While our article focuses on candlestick charts, Pocket Option also offers other price display types (line, bar, Heikin-Ashi), allowing traders to switch between them to gain different perspectives on the market.
- Quick timeframe switching: The intuitive interface allows instant switching between different timeframes, from seconds to months, which is essential for multi-timeframe analysis and quick reactions to market changes.
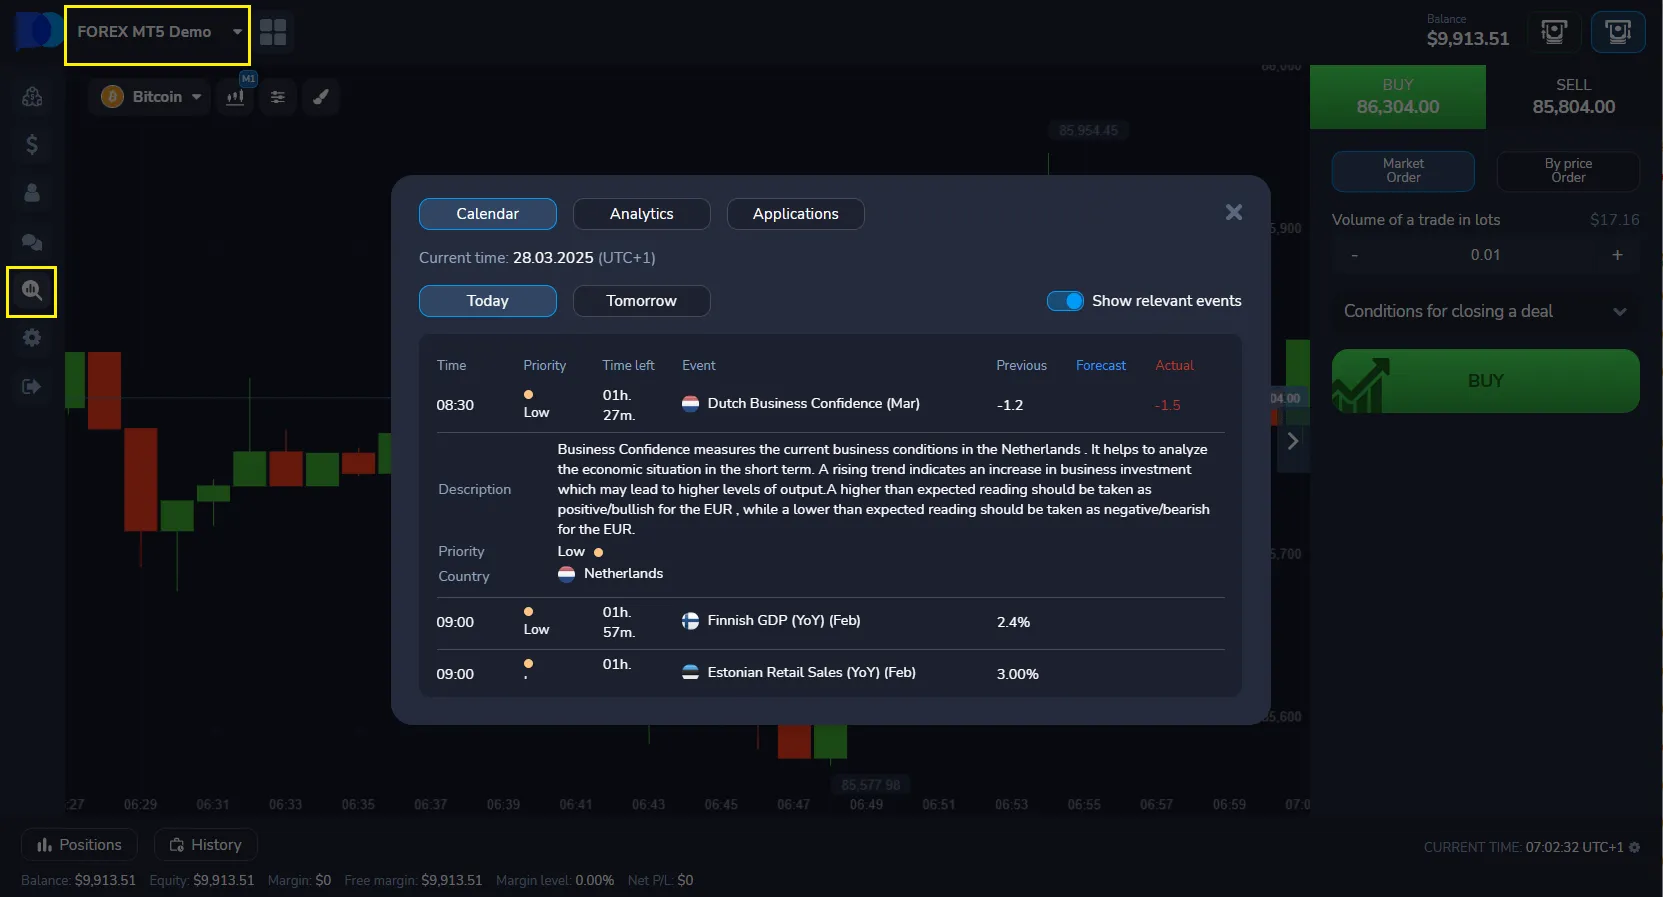
Integration with Other Analytical Tools
Pocket Option understands that comprehensive analysis requires the use of various tools. The platform ensures seamless integration of candlestick charts with:
- Economic calendar: The built-in economic calendar allows traders to track important economic news and events that may affect price movement. This helps to understand why candlesticks behave a certain way during news releases.
- Trading signals: The platform provides access to trading signals that can serve as additional confirmation for candlestick patterns. However, it is always recommended to conduct your own Candlestick chart analysis before making a trading decision.
- Analytics and news: Built-in news feeds and analytical reviews help traders stay informed about the latest market developments, complementing technical analysis and enabling more well-founded decisions.
Mobile Analysis: Working with Candlesticks in the Pocket Option App
In today’s world, mobility plays a key role. Pocket Option offers fully functional mobile applications for iOS and Android, enabling Candlestick chart analysis anytime and anywhere:
- Full functionality: The Pocket Option mobile apps provide almost the entire functionality of the desktop version, including access to candlestick charts, indicators, drawing tools, and the ability to execute trades.
- User-friendly interface: The mobile interface is optimized for touchscreens, making chart analysis and trading as convenient as possible, even on smaller devices.
- Notifications: Customizable alerts for price levels or important events help traders avoid missing critical moments, even when away from their computer.
This allows traders to stay connected to the market and respond promptly to the formation of Candlestick patterns, no matter where they are.
Social Trading: Sharing Ideas on Candlestick Analysis
Pocket Option actively develops social trading features, offering unique opportunities for traders who use candlestick analysis:
- Copy trading: The ability to copy the trades of successful traders allows beginners to learn from experienced market participants and earn profits even without in-depth knowledge of Candlestick chart analysis.
- Chat and community: The built-in chat and active trader community make it easy to exchange ideas, discuss Candlestick patterns, ask questions, and get feedback — a valuable resource for learning and skill development.
- Trader rankings: Transparent rankings of successful traders help identify those who effectively use candlestick analysis and learn from their strategies.
Social trading on Pocket Option creates an environment for collective learning and experience sharing, accelerating mastery of Trading with candlestick charts.
Educational Resources on Candlestick Charts at Pocket Option
Pocket Option aims to ensure its users are well-educated. The platform offers a variety of educational resources to deepen your knowledge of Candlestick chart analysis:
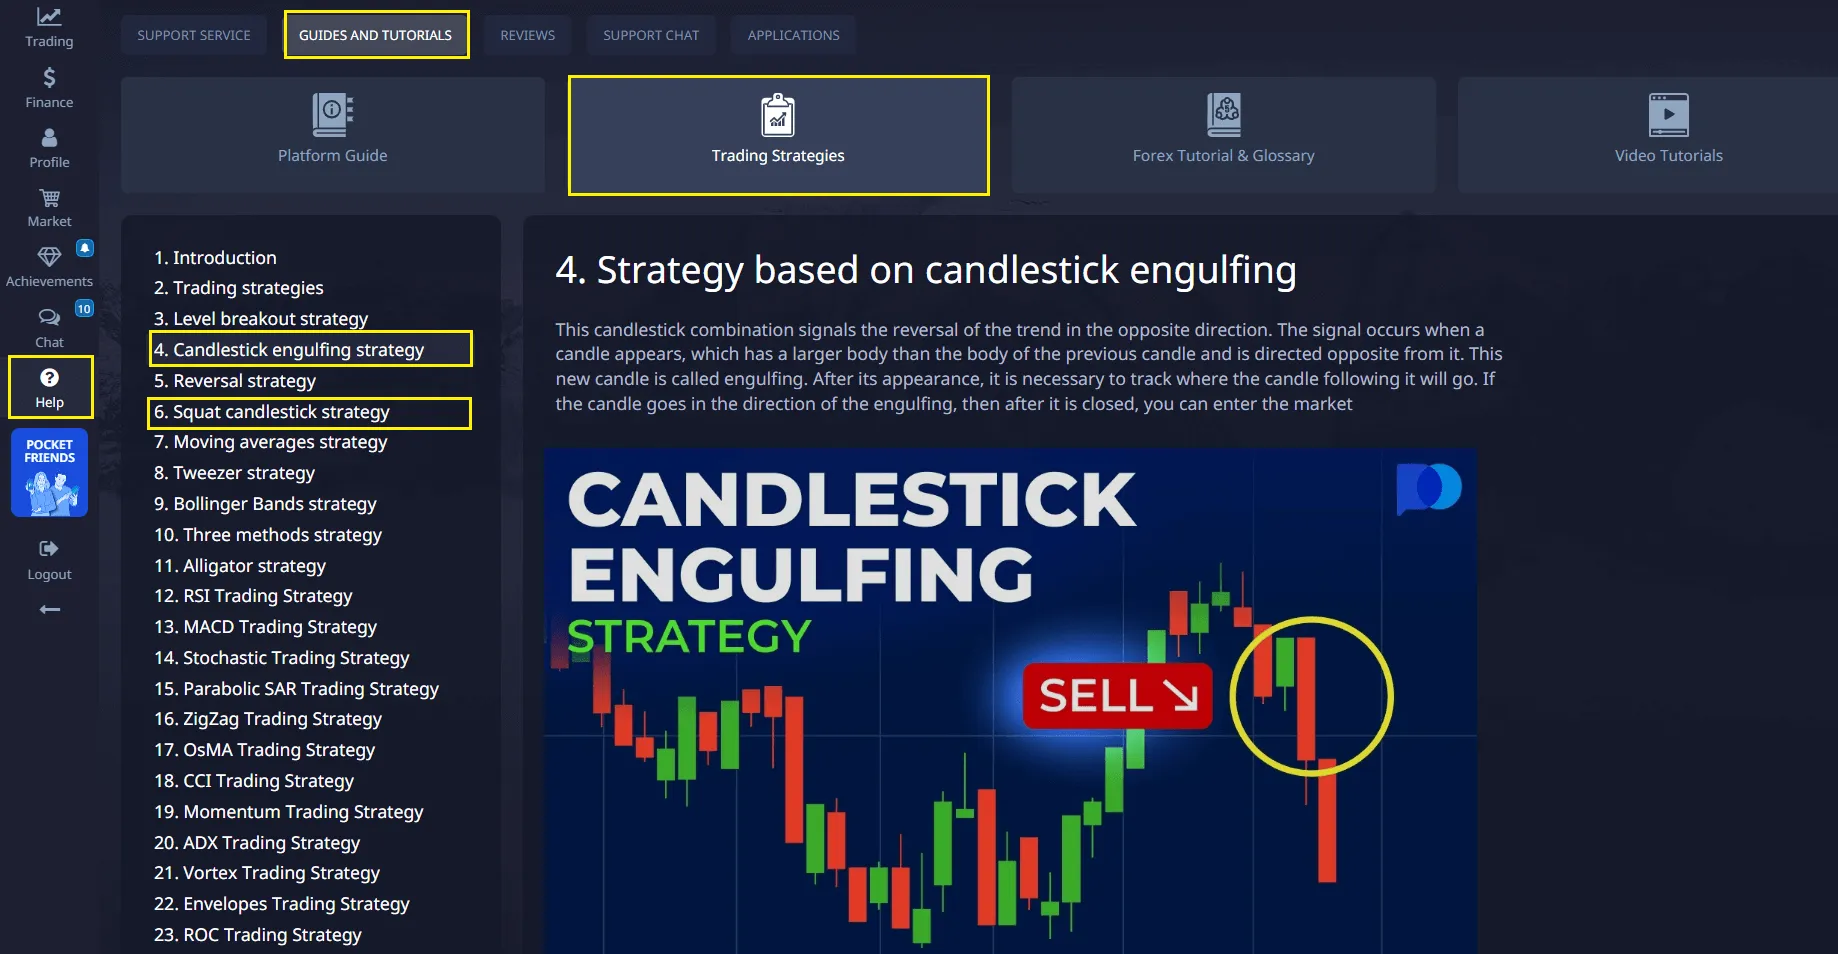
- Training materials: Access to articles, video lessons, and webinars dedicated to candlestick charts, their anatomy, and both basic and advanced Candlestick patterns.
- Glossary: A clear glossary of terms related to candlestick analysis helps you quickly understand and master professional terminology.
All these unique features make Pocket Option not just a trading platform, but a complete ecosystem for learning and applying Candlestick chart analysis, significantly increasing traders’ chances of success.
Advanced Candlestick Analysis Techniques and Their Application
After mastering the basic and advanced Candlestick patterns and understanding their psychological background, the next step in developing your Candlestick chart analysis skills is to study more complex techniques. These methods allow you to interpret market signals more deeply, increase the accuracy of forecasts, and adapt to various market conditions. In this chapter, we will look at several advanced techniques that will help you take your Candlestick chart trading strategy to a new level.
Volume analysis in combination with candlesticks
Trading volume is one of the most important confirming indicators for candlestick analysis. It shows the number of shares, contracts, or lots that were sold and bought during a certain period of time. High volume indicates strong interest of market participants in the current price movement, while low volume may signal trend weakness or uncertainty.
- Trend confirmation: If the price moves in the direction of the trend (for example, an uptrend) and this is accompanied by an increase in volume, this confirms the strength of the trend. Conversely, if the trend continues on declining volume, this may be a sign of its weakening.
- Confirmation of reversal patterns: Reversal Candlestick patterns (such as Engulfing, Hammer, Morning/Evening Star) become significantly more reliable if they form on high volume. This indicates that a significant number of market participants are behind the reversal.
- False breakouts: If the price breaks an important support or resistance level but this occurs on low volume, it may be a false breakout. Conversely, a breakout on high volume confirms its validity.
- Buying/Selling climax: Very high volumes at the peak of an uptrend (buying climax) or at the bottom of a downtrend (selling climax) often precede a reversal. These are moments when most market participants have already entered the trade, and few remain to push the price further.
On the Pocket Option platform, you can easily add the volume indicator to your candlestick charts to use this powerful technique in your analysis.
Using candlesticks to determine support and resistance levels
Candlesticks not only show where support and resistance levels are located, but also help determine their strength and reliability. Support and resistance levels are price zones where significant buying pressure (support) or selling pressure (resistance) has historically been observed.
- Pattern formation at levels: If a reversal Candlestick pattern forms exactly at a support or resistance level, this significantly increases its importance. For example, a bullish engulfing pattern at a support level is a very strong buy signal.
- Testing levels: Candlesticks can show how the price tests these levels. If the price approaches a resistance level and forms a long upper shadow (as in the “Shooting Star” pattern), this indicates price rejection and confirms the strength of the resistance.
- Level breakout: Long, strong candles breaking support or resistance levels on high volume indicate a true breakout and the start of a new movement. Short candles or candles with long shadows on a breakout may signal a false breakout.
- Role reversal: After a breakout, the resistance level often becomes support, and vice versa. Candlesticks can confirm this role reversal by forming reversal patterns at the new level.
Combining candlesticks with trendlines and channels
Trendlines and price channels are fundamental tools of technical analysis that complement candlestick analysis perfectly. They help determine the direction and strength of a trend, as well as potential reversal points.
- Trendline breakout confirmation: If the price breaks the trendline and this is accompanied by the formation of a strong reversal Candlestick pattern in the opposite direction, this is a powerful signal of a trend change.
- Bounce from the trendline: If the price approaches a trendline and forms a trend continuation pattern (for example, “Three Methods”), this confirms the strength of the trend and is a good entry point.
- Trading within a channel: In a price channel, traders can look for bullish patterns at the lower boundary of the channel (support) and bearish patterns at the upper boundary (resistance).
The drawing tools on the Pocket Option platform make it easy to build trendlines and channels, visualizing these important relationships.
Candlestick patterns and indicator divergences
A divergence is a discrepancy between price movement and indicator movement (for example, RSI, MACD, Stochastic). Divergences are powerful signals of a potential trend reversal and are greatly strengthened when confirmed by candlestick patterns.
- Bullish divergence: The price forms a lower low, while the indicator forms a higher low. This indicates a weakening of the downward momentum. If at this moment a bullish Candlestick pattern appears on the chart (for example, Hammer or Bullish Engulfing), this is a very strong buy signal.
- Bearish divergence: The price forms a higher high, while the indicator forms a lower high. This indicates a weakening of the upward momentum. If at this moment a bearish Candlestick pattern appears on the chart (for example, Hanging Man or Bearish Engulfing), this is a very strong sell signal.
Divergences confirmed by candlestick patterns are among the most reliable reversal signals because they show that the “internal” market strength (momentum) differs from price movement.
Practicing advanced techniques on Pocket Option
Mastering these advanced techniques requires practice.
- Start with one: Do not try to master all the techniques at once. Choose one (for example, volume analysis) and focus on it until you feel confident.
- Combine: Gradually add other techniques to see how they interact and reinforce each other. For example, look for reversal patterns at support/resistance levels confirmed by high volume and bullish divergence.
- Use historical data: Review historical charts on Pocket Option to find examples of using these techniques. Note how the price reacted to signals.
- Keep a journal: Continue keeping a trading journal, recording your observations and results. This will help you identify which combinations of techniques work best for you and your trading style.
Advanced Candlestick chart analysis techniques allow the trader to see the market more deeply than just price movements. They make it possible to understand the hidden forces driving the market and to make more informed and profitable trading decisions on the Pocket Option platform.
Practical Examples of Trading Using Candlestick Charts
Theoretical knowledge of Candlestick patterns and Candlestick chart analysis becomes truly valuable only when applied in practice. In this chapter, we will look at several practical examples of trading situations on the Pocket Option platform, where candlestick charts play a key role in decision-making. These examples will help you better understand how to integrate all the acquired knowledge into a real trading strategy.
Example 1: Bullish Reversal with “Hammer” Pattern and Support Level
Situation: On the EUR/USD chart (1-hour timeframe), there is a steady downtrend. The price is approaching a strong historical support level, which has previously repelled the price upward several times.
Candlestick analysis: When the price reaches the support level, a “Hammer” candle forms. The candle body is small and green, and the lower shadow is very long, indicating strong buying pressure that pushed the price back up from the drop. Trading volume at the moment the Hammer forms increases significantly, confirming the strength of the pattern.
Additional confirmation: The RSI indicator, which was previously in the oversold zone (below 30), starts turning upward, confirming the weakening of bearish momentum.
Trading decision:
- Entry: After the Hammer candle closes and the next bullish candle confirms it (closing above the Hammer’s high), a buy position is opened.
- Stop-loss: Placed just below the Hammer’s lower shadow, beyond the support level, to limit potential losses if the reversal does not occur.
- Take-profit: Placed at the nearest strong resistance level or based on a risk/reward ratio of 1:2 or 1:3.
Result: The price reverses upward, forming a new uptrend and reaching the take-profit, confirming the effectiveness of Candlestick chart analysis in combination with support levels and indicators.
Example 2: Bearish Reversal with “Evening Star” Pattern and Resistance Level
Situation: On the GBP/JPY chart (4-hour timeframe), there is a strong uptrend. The price reaches a key resistance level that previously acted as a ceiling for the price.
Candlestick analysis: At the resistance level, the “Evening Star” pattern forms. It consists of three candles: a large green candle, followed by a small indecision candle (Doji or Spinning Top) that opens with an upward gap, and then a large red candle that opens with a downward gap and closes significantly below the midpoint of the first green candle. This pattern signals a shift in sentiment from bullish to bearish.
Additional confirmation: The MACD indicator shows bearish divergence (the price makes a new high, while the MACD makes a lower high), indicating weakening bullish momentum. Trading volume increases on the last red candle of the pattern.
Trading decision:
- Entry: After the last red candle of the Evening Star closes, a sell position is opened.
- Stop-loss: Placed just above the high of the middle candle of the Evening Star pattern, beyond the resistance level.
- Take-profit: Placed at the nearest strong support level or based on the risk/reward ratio.
Result: The price starts moving downward, confirming the reversal predicted by the Evening Star pattern and MACD divergence.
Example 3: Trend Continuation with “Three White Soldiers” Pattern
Situation: On the USD/CAD chart (daily timeframe), there is a steady uptrend. After a small correction, the price begins to rise again.
Candlestick analysis: After the correction, the “Three White Soldiers” pattern forms—three consecutive long green candles, each opening within the body of the previous one and closing above its high. This indicates strong and sustained buying pressure and the resumption of the uptrend.
Additional confirmation: The price is above the 50-period moving average, which acts as dynamic support. Trading volume increases with each new bullish candle.
Trading decision:
- Entry: After the third candle of the Three White Soldiers pattern closes, a buy position is opened.
- Stop-loss: Placed below the low of the first candle of the pattern or below the 50-period moving average.
- Take-profit: Placed at the next major resistance level or as the trend develops, using a trailing stop.
Result: The uptrend continues, confirming the strength of the Three White Soldiers pattern as a trend continuation signal.
Example 4: False Breakout with “Pin Bar” Pattern
Situation: On the Gold chart (30-minute timeframe), the price attempts to break an important resistance level.
Candlestick analysis: The price breaks the resistance level but then forms a candle resembling a “Pin Bar” (similar to a Hammer, but can be bullish or bearish, with a long shadow indicating price rejection). In this case, it is a bearish pin bar with a long upper shadow extending well above the resistance level, while the candle body closes below the level. This indicates that buyers failed to keep the price above the level, and sellers pushed it back down.
Additional confirmation: Trading volume during the breakout was low, and then rose sharply at the moment the pin bar formed, confirming price rejection. The Stochastic indicator shows overbought conditions.
Trading decision:
- Entry: After the pin bar closes, a sell position is opened.
- Stop-loss: Placed just above the upper shadow of the pin bar, beyond the resistance level.
- Take-profit: Placed at the nearest support level.
Result: The price reverses downward, confirming the false breakout and the strength of the resistance level.
Risk and Capital Management in Candlestick Chart Trading
Even the most advanced Candlestick chart trading strategy will not bring success without strict risk and capital management. The market is unpredictable, and losing trades are an integral part of trading. The goal of risk management is to minimize losses and protect your trading capital so that you can stay in the game in the long term. In this chapter, we will look at the key principles of risk and capital management applicable to trading with candlestick charts.
Why Risk Management Is More Important Than a Trading Strategy
Many beginner traders focus solely on finding the “Holy Grail”—the perfect trading strategy that always generates profits. However, experienced traders know that the key to long-term success lies not in a flawless strategy but in effective risk management. Here’s why:
- Inevitability of losses: No trading strategy can be profitable 100% of the time. Losing trades will happen, and that’s normal. Risk management allows you to control the size of those losses.
- Capital protection: The main task of risk management is to preserve your trading capital. If you lose too much, you simply won’t have the funds to continue trading.
- Psychological stability: Knowing that your risks are under control reduces stress and helps you make rational decisions without succumbing to fear or greed.
- Long-term perspective: Only with proper risk management can you survive drawdown periods and wait for profitable streaks, ensuring steady deposit growth.
Basic Principles of Risk Management
- The 1% (or 2%) Rule: Never risk more than 1–2% of your total trading capital on a single trade. This means that if your trade hits the stop-loss, you lose no more than 1–2% of your deposit. For example, if you have 1000 in your account, the maximum loss per trade should not exceed 10–20.
Position size calculation: The position size should be calculated so that if the stop-loss is triggered, the loss does not exceed the set percentage of your deposit. This is done using the formula:
Position Size = (Deposit Size * Risk Percentage) / (Distance to Stop-Loss in Pips * Pip Value)
Pocket Option provides convenient tools for calculating lot size.
- Using Stop-Loss Orders: A stop-loss is an order that automatically closes your position if the price reaches a certain level, limiting your losses. This is the most important risk management tool. Always place a stop-loss immediately after opening a trade.
Stop-loss placement: When trading candlestick patterns, the stop-loss is usually placed beyond the extreme of the pattern or the nearest strong support/resistance level. For example, for a bullish “Hammer” pattern, the stop-loss is set just below its lower shadow.
- Setting a Take-Profit: A take-profit is an order that automatically closes your position when the price reaches a certain profit level. This allows you to lock in profits and prevent them from “evaporating” if the market reverses.
Take-profit placement: Take-profit is usually set at the nearest strong resistance level (for buys) or support level (for sells), or based on a predetermined risk/reward ratio.
- Risk/Reward Ratio: This is the ratio of potential loss to potential profit in a single trade. Always aim for a ratio of at least 1:2 or 1:3. This means that for every dollar at risk, you expect to gain two or three dollars in profit. Even if you are correct only 50% of the time, you will still be profitable.
Example: If your stop-loss is 20 pips, the take-profit should be at least 40–60 pips.
- Trailing Stop: This is a dynamic stop-loss that automatically moves with the price when it moves in a profitable direction. It allows you to protect already gained profits and let the trade run further. If the price reverses, the trailing stop is triggered, locking in part of the profit.
Capital Management and Diversification
- Portfolio diversification: Don’t invest all your funds in a single asset or trading strategy. Distribute risks across different assets (currencies, stocks, commodities) and possibly different strategies. This reduces overall risk if one asset or strategy performs poorly.
- Don’t trade with last funds: Use only money that you are willing to lose without affecting your financial situation. Trading with borrowed funds or money intended for essential needs leads to immense psychological pressure and mistakes.
- Keeping a trading journal: As already mentioned, a detailed trading journal is an indispensable tool for capital management. It allows you to analyze your trades, identify mistakes in risk management, and adjust your strategy.
- Regular review: Periodically review your risk management and capital management rules. The market changes, and your rules should adapt to those changes.
Frequently Asked Questions (FAQ) about Candlestick Trading Charts
When learning Candlestick Trading Charts and applying them in trading, beginners and even experienced traders often have questions. This chapter aims to answer the most common ones to reinforce the acquired knowledge and dispel possible doubts. We will cover questions related to basic concepts, pattern application, risk management, and the use of the Pocket Option platform.
General Questions about Candlestick Charts
What is a Candlestick Trading Chart, and how does it differ from other types of charts?
A Candlestick Trading Chart is a type of financial chart that visually represents the price movement of an asset over a specific period. Each candlestick shows the open, close, high, and low prices. Unlike line charts, which show only the closing price, or bar charts, candlesticks provide a fuller and more intuitive picture of the battle between buyers and sellers, making them an indispensable tool for Candlestick chart analysis.
Why are candlestick charts called “Japanese candlesticks”?
Candlestick charts were developed in Japan in the 18th century by Munehisa Homma, a rice trader, to analyze rice prices. He noticed that the market moves not only under the influence of supply and demand but also under the influence of traders’ emotions. His methods formed the basis of modern candlestick analysis, which is why they are often called “Japanese candlesticks.”
Can candlestick charts be used to trade any assets?
Yes, Candlestick Trading Charts are universal and can be applied to analyze any financial instrument with price movement: currency pairs (Forex), stocks, indices, commodities (gold, oil), cryptocurrencies, etc. They are equally effective in all markets.
How reliable are candlestick patterns?
The reliability of candlestick patterns varies. Some patterns, such as “Engulfing” or “Morning/Evening Star,” are considered more reliable than others. However, no pattern offers a 100% guarantee. Pattern reliability increases significantly if it appears in the context of the overall trend, at important support/resistance levels, and is confirmed by trading volume or other technical indicators. Always use Candlestick chart analysis as part of a comprehensive Candlestick chart trading strategy.
Questions about Pattern Application
What is a “Doji,” and what does it indicate?
A Doji is a candle where the opening and closing prices are almost identical, forming a very short body. It indicates market indecision, where neither buyers nor sellers could gain control. A Doji often signals a potential trend reversal, especially if it appears after a prolonged move or at key levels.
What is the difference between a “Hammer” and a “Hanging Man”?
A Hammer and a Hanging Man have the same shape (small body, long lower shadow, short or no upper shadow), but their meaning depends on the context. A Hammer is a bullish reversal pattern appearing after a downtrend. A Hanging Man is a bearish reversal pattern appearing after an uptrend.
How can you distinguish bullish engulfing from bearish engulfing?
Bullish Engulfing forms after a downtrend: a small red candle is completely engulfed by a large green candle. Bearish Engulfing forms after an uptrend: a small green candle is completely engulfed by a large red candle.
Should you wait for confirmation after a pattern forms?
Yes, it is always recommended to wait for confirmation. Confirmation can be the closing of the next candle in the direction predicted by the pattern, or confirmation from other indicators (such as volume or RSI). This helps filter out false signals.
Questions about Trading Strategy and Risk Management
Which timeframe is best for candlestick analysis?
There is no “best” timeframe; the choice depends on your trading style. Short timeframes (1–15 minutes) are suitable for scalping, medium ones (1–4 hours) for day trading and swing trading, and long ones (daily, weekly) for long-term investments. It is recommended to use multi-timeframe analysis to confirm signals.
How to correctly set a stop-loss when trading candlestick patterns?
A stop-loss is usually placed beyond the extreme of the candlestick pattern that generated the signal. For example, for a bullish “Hammer” pattern, the stop-loss is placed just below its lower shadow. For a bearish “Hanging Man” pattern, it is placed just above its upper shadow. This allows you to limit losses if the pattern fails.
What risk/reward ratio is considered optimal?
An optimal risk/reward ratio is at least 1:2 or 1:3. This means the potential profit should be at least two or three times greater than the potential loss. Such a ratio allows you to remain profitable even if the number of winning trades is less than losing ones.
Can you trade using only candlestick patterns?
Although candlestick patterns are a powerful tool, it is recommended to use them in combination with other technical analysis tools (support/resistance levels, trend lines, indicators) for more reliable signals. A comprehensive approach is always more effective.
Questions about Pocket Option
How to set up candlestick charts in Pocket Option?
On the Pocket Option platform, you can select the “Japanese Candlesticks” chart type in the chart type menu. You can also set the timeframe, add indicators, and use drawing tools for analysis.
Does Pocket Option have a demo account for practicing candlestick analysis?
Yes, Pocket Option provides a free account with virtual funds. This is an ideal tool for practicing the recognition of candlestick patterns, testing trading strategies, and improving risk management skills without any financial risk. It is strongly recommended to use it before switching to a live account.
Can I use the Pocket Option mobile app for candlestick analysis?
Yes, Pocket Option mobile apps for iOS and Android provide full functionality for Candlestick chart analysis, including access to candlestick charts, indicators, and drawing tools. This allows you to analyze the market and trade anytime, anywhere.
Where can I find educational materials about candlestick charts on Pocket Option?
Pocket Option offers various educational materials, including articles, video tutorials, and webinars available on the platform.
This chapter is designed to provide clear and concise answers to the most frequently asked questions, helping you strengthen your knowledge and confidence in using Candlestick Trading Charts.
Conclusion: Mastering Candlestick Analysis and the Path to Success
We have come a long way in exploring the Candlestick Trading Chart — from its historical origins and basic anatomy to advanced patterns, integration with other tools, and the essential aspects of risk management. Now that you possess in-depth knowledge of Candlestick chart analysis, it is time to summarize and outline your further path toward becoming a successful trader.
Candlesticks as the Language of the Market
Candlestick charts are not just a way of displaying prices; they are a universal language of the market that allows traders to “read” its sentiment, anticipate potential reversals, and recognize trend continuations. Each candlestick tells a story of the battle between buyers and sellers, reflecting their emotions, strength, and determination. The ability to interpret this language is a skill that comes with practice and a deep understanding of market psychology.
We have examined how single candlesticks, such as the Doji, Hammer, and Hanging Man, can indicate indecision or a potential reversal. We have delved into more complex Candlestick patterns, such as the Engulfing, Morning Star, and Evening Star, which are powerful indicators of trend change. We also studied continuation patterns like Three White Soldiers and Three Black Crows, which confirm the strength of the current movement.
A Comprehensive Approach to Trading
It is important to remember that Candlestick chart analysis is a powerful tool, but not the only one. It is most effective when combined with other technical analysis methods:
- Support and resistance levels: Patterns forming at these key levels tend to be far more reliable.
- Trendlines and channels: Help determine the overall market direction and potential entry/exit points.
- Indicators and oscillators: Tools such as RSI, MACD, and moving averages can confirm candlestick signals, filter false ones, and indicate divergences that precede reversals.
- Trading volume: Always use volume to confirm the strength of candlestick patterns and breakouts.
A comprehensive approach — where candlestick analysis serves as the main tool for identifying entry and exit points, and other indicators act as confirming filters — is the key to a successful Candlestick chart trading strategy.
The Role of Pocket Option in Your Success
The Pocket Option platform provides all the necessary tools and conditions for the effective application of candlestick analysis:
- Convenient and customizable charts: Easily switch between timeframes, add indicators, and use drawing tools.
- Access to various assets: A wide range of trading instruments for applying candlestick analysis.
- Educational resources: Materials to deepen your knowledge and skills.
- Social trading: Learn from other traders and exchange experiences.
- Mobile apps: Analyze and trade anytime, anywhere.
Discipline, Practice, and Risk Management
Mastery in Candlestick chart analysis and successful trading is not the result of luck, but the product of hard work, discipline, and continuous learning. Remember these key principles:
- Discipline: Stick strictly to your trading plan and do not give in to emotions. Enter trades only when there are clear signals, and exit according to predetermined rules.
- Practice: The more you analyze charts, look for patterns, and test your strategies, the faster you will develop intuition and a “market eye.”
- Risk management: Your main protector. Always risk only a small portion of your capital on a single trade, use stop losses, and aim for a positive risk/reward ratio. Protecting your capital is priority number one.
- Continuous learning: The market is constantly changing, and a successful trader always learns, adapts, and improves their skills.
Candlestick Trading Chart is a powerful tool in the hands of a skilled trader. By mastering it, you will gain a deep understanding of market dynamics and be able to make more informed and profitable trading decisions.
May your journey in the trading world be successful and profitable!
FAQ
What makes candlestick charts effective for market analysis?
Candlestick charts provide comprehensive price information including opening, closing, high, and low prices in a single visual element, making them efficient for quick market analysis.
How can beginners start learning candlestick pattern recognition?
Beginners should focus on basic patterns first, practice with historical data, and maintain a trading journal to document pattern observations and outcomes.
What are the most reliable candlestick patterns?
Common reliable patterns include Doji, Engulfing patterns, and Morning/Evening stars, especially when confirmed with volume indicators.
How does Pocket Option implement candlestick chart analysis?
Pocket Option provides integrated charting tools with multiple timeframes, pattern recognition features, and customizable indicators for comprehensive analysis.
What timeframes work best for candlestick analysis?
The most effective timeframes depend on trading style - ranging from 1-minute charts for scalping to daily charts for position trading.
Trading
Sign up for more like this
Customize your newsfeed with content you're actually interested in — get up-to-date personalized newsletter in your inbox.
Your comment
Comments are pre-moderated to ensure they comply with our blog guidelines.