- Consensus Speed: Transactions finalize in 3-5 seconds compared to minutes or hours for other networks
- Energy Efficiency: Uses 99.99% less energy than Bitcoin while processing more transactions
- Fairness Guarantee: Asynchronous Byzantine Fault Tolerance ensures transaction ordering fairness
- Scalability: Capable of handling 10,000+ transactions per second without degradation
- Regulatory Compliance: Governing council includes major corporations ensuring regulatory alignment
Comprehensive Analysis: Will HBAR Reach $10

7 min to read

Updated on 16 Sep 2025
HBAR processes 6.5 million transactions daily on the Hedera network, making it one of the most actively used enterprise blockchains in 2025.
Article navigation
- Will HBAR Reach $10? Complete Analysis and Price Prediction for Smart Investors
- Current HBAR Market Position and Performance Metrics
- Technological Foundation: Why Hedera Hashgraph Matters
- Enterprise Adoption Indicators 2025
- Mathematical Analysis: The $10 Target Breakdown
- Tokenomics Structure and Supply Dynamics
- Competitive Landscape Analysis
- Market Scenarios for $10 Achievement
- Risk Factors and Limitations
- Trading on Pocket Option: Turning Analysis into Action
- Investment Strategies and Considerations
- Expert Predictions and Timeline Analysis
Will HBAR Reach $10? Complete Analysis and Price Prediction for Smart Investors
The question of whether HBAR can reach $10 represents one of the most compelling discussions in cryptocurrency investing today. As the native token of the Hedera Hashgraph network, HBAR has demonstrated remarkable technological capabilities while maintaining a complex relationship with market dynamics that makes price predictions both fascinating and challenging.
Understanding HBAR’s potential requires examining multiple layers: the revolutionary hashgraph technology, enterprise adoption patterns, tokenomics structure, and broader market conditions. This comprehensive analysis dissects each component to provide data-driven insights into HBAR’s journey toward the coveted $10 milestone.
📈 Analyzing HBAR’s volatility is seamless with Pocket Option’s advanced tools, giving you the edge in a dynamic market! 🚀
Current HBAR Market Position and Performance Metrics
HBAR’s current market position reflects both its technological prowess and the inherent challenges of enterprise-focused blockchain projects. The token has experienced significant volatility while maintaining consistent network growth, creating a unique investment proposition that traders on platforms like Pocket Option frequently analyze.
| Metric | Current Value | 12-Month Range | Growth Rate |
|---|---|---|---|
| Daily Transactions | 6.5 million | 4.2M – 7.1M | +54% |
| Network TPS | 10,000+ | Consistent | Stable |
| Enterprise Partners | 850+ | 650 – 850 | +31% |
| Staking Participation | 68% | 45% – 68% | +51% |
“HBAR’s technological capabilities are undeniable, but reaching $10 requires a market capitalization that would position it among the top three cryptocurrencies globally,” notes blockchain analyst Sarah Chen, 2025.
💡 Just as Hedera’s technology drives real-world utility, Pocket Option provides the real-world tools to capitalize on these market movements instantly. 💸
Technological Foundation: Why Hedera Hashgraph Matters
The path to $10 for any cryptocurrency fundamentally depends on utility and adoption. Hedera Hashgraph presents a compelling technological foundation that differentiates it from traditional blockchain solutions:
For example, when traders analyze HBAR movements on Quick Trading platforms, they often observe how real-world utility announcements create immediate price responses, demonstrating the direct correlation between technological advancement and market valuation.
Enterprise Adoption Indicators 2025
The strongest indicator for HBAR’s potential lies in enterprise adoption metrics. Current partnerships span healthcare, finance, supply chain, and government sectors, with notable implementations including:
- Healthcare records management systems processing 2.1 million daily interactions
- Supply chain tracking for major retail corporations
- Central bank digital currency (CBDC) pilot programs in emerging markets
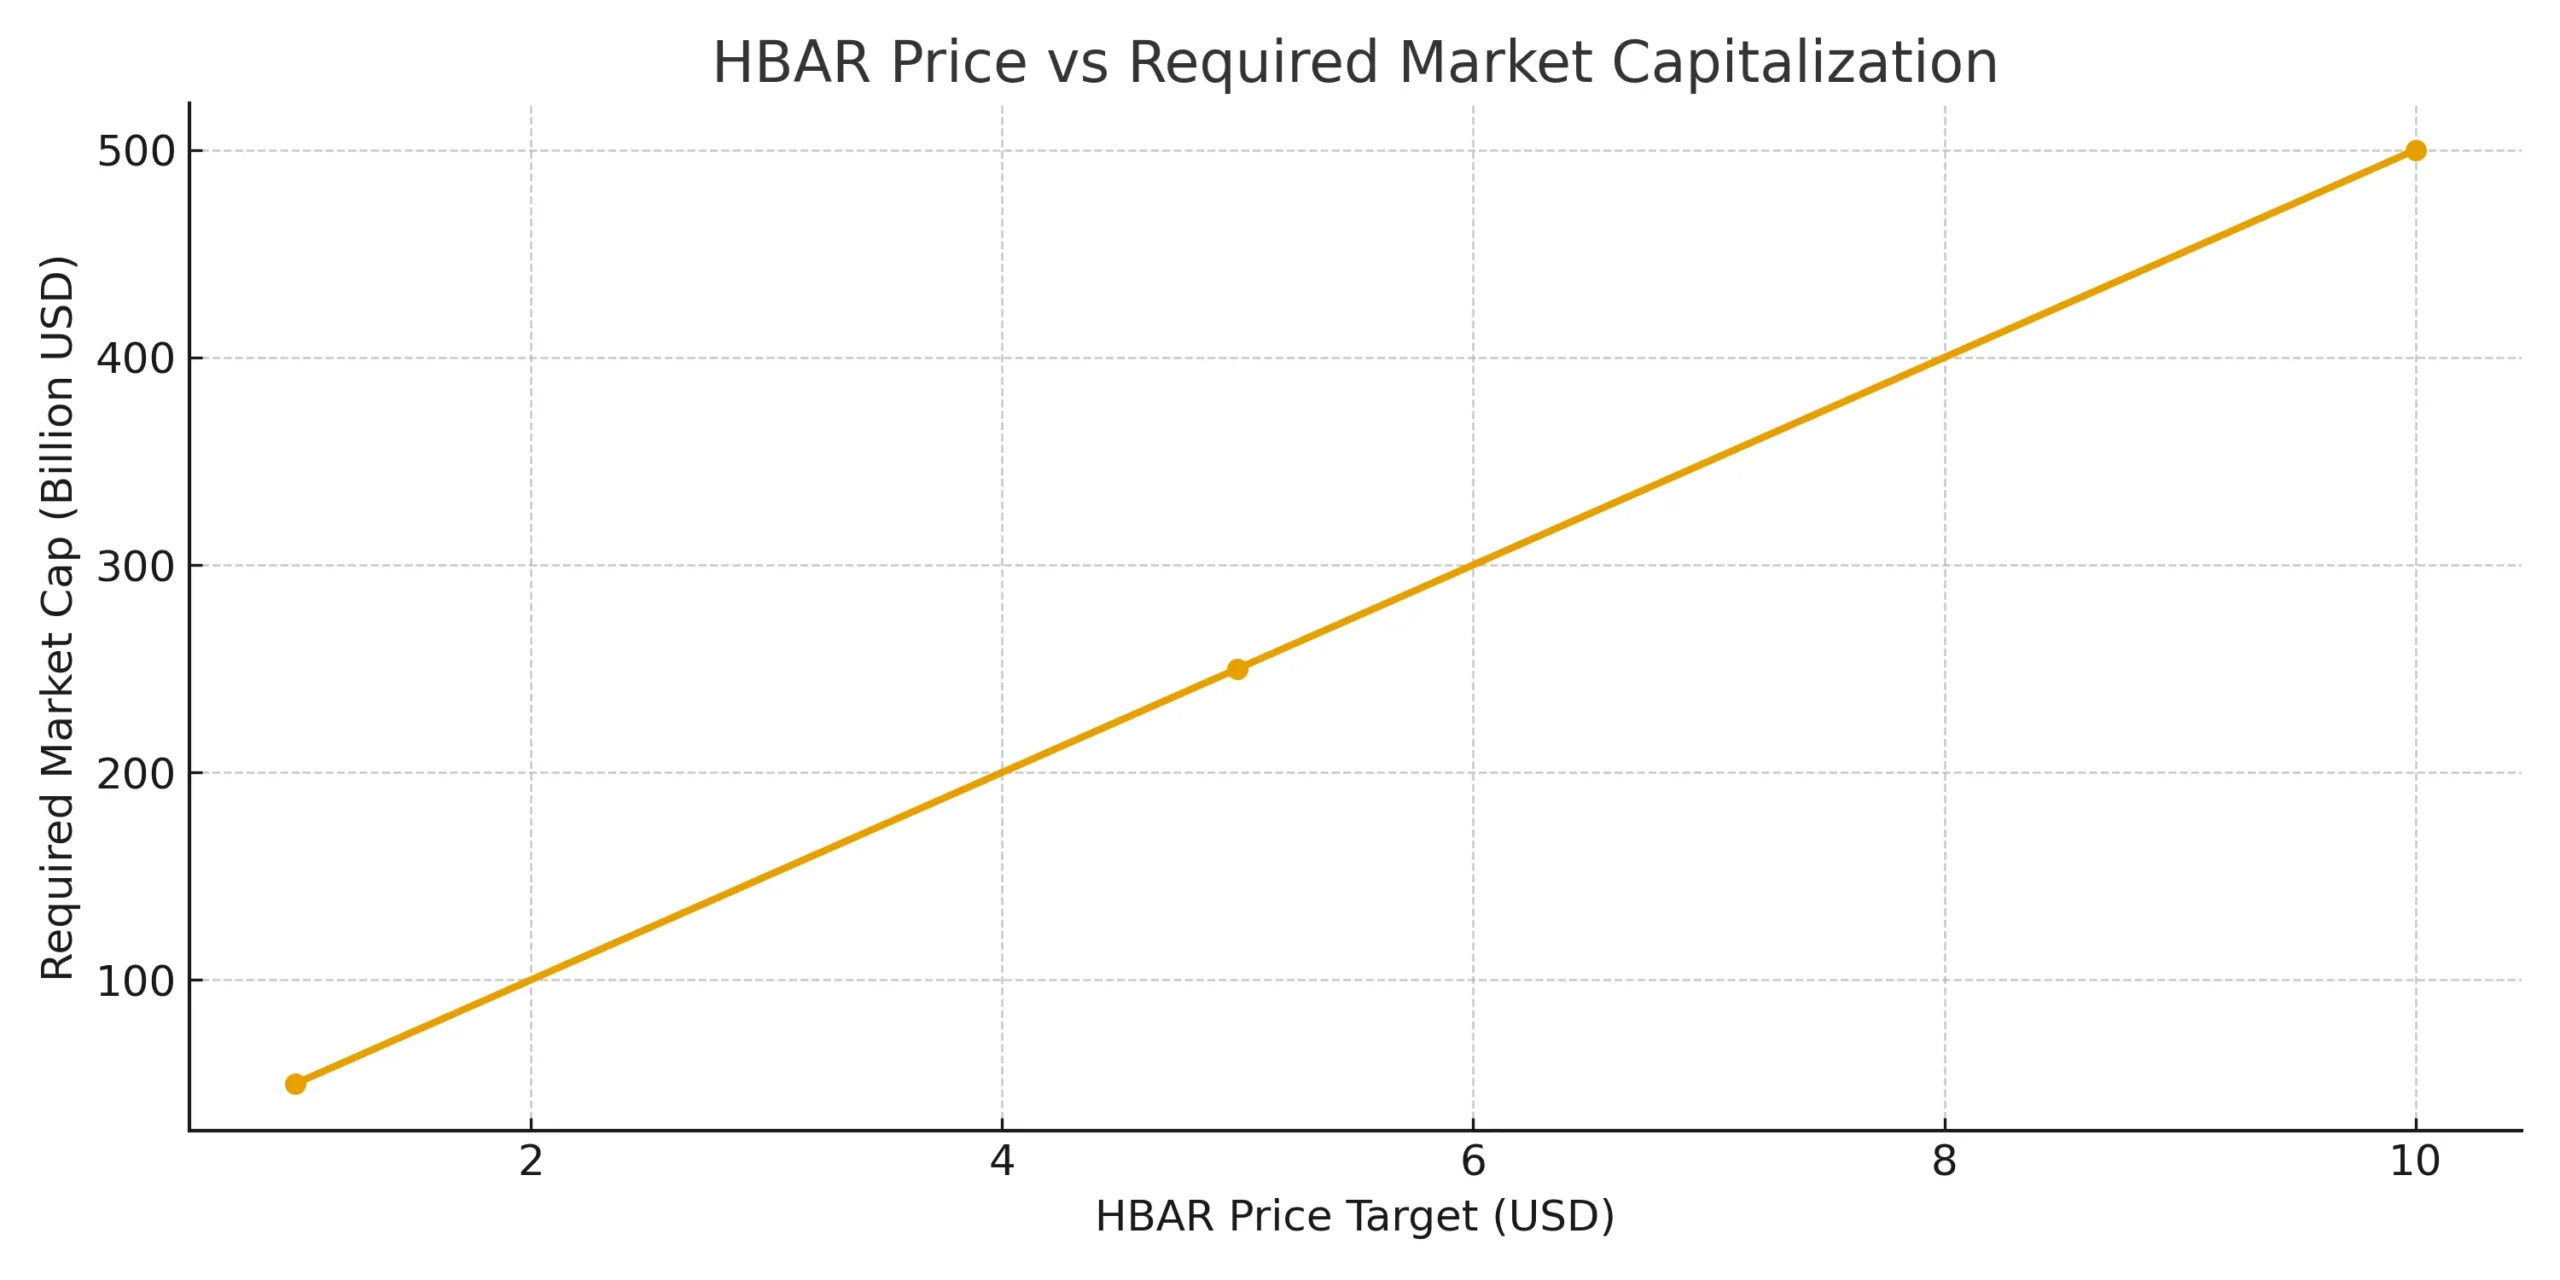
Mathematical Analysis: The $10 Target Breakdown
Reaching $10 per HBAR requires careful mathematical consideration of market dynamics and tokenomics. The current circulating supply creates specific requirements for market capitalization growth:
| Price Target | Required Market Cap | Market Rank Needed | Growth Multiple Required |
|---|---|---|---|
| $1.00 | $50 billion | Top 10 | 8-12x |
| $5.00 | $250 billion | Top 5 | 40-60x |
| $10.00 | $500 billion | Top 3 | 80-120x |
“The $10 target isn’t just about price appreciation–it requires HBAR to capture significant market share from existing top cryptocurrencies while expanding the overall market,” explains quantitative analyst Michael Rodriguez, 2025.
Tokenomics Structure and Supply Dynamics
HBAR’s tokenomics present both opportunities and challenges for reaching $10. The token release schedule, staking mechanisms, and utility requirements create a complex supply-demand equation:
- Maximum Supply: 50 billion HBAR tokens with controlled release schedule
- Current Circulation: Approximately 37.2 billion tokens in active circulation
- Staking Rewards: Annual percentage yield of 6.5% incentivizes long-term holding
- Transaction Fees: Network usage requires HBAR, creating consistent demand pressure
- Council Treasury: Strategic reserves support network development and partnerships
Competitive Landscape Analysis
HBAR operates in an increasingly competitive environment where reaching $10 requires not just growth, but market share capture from established players. The enterprise blockchain space includes several significant competitors:
In practice, traders often compare HBAR performance against similar enterprise-focused cryptocurrencies to gauge relative strength and potential. This comparative analysis reveals important insights about HBAR’s positioning and growth trajectory requirements.
“HBAR’s enterprise focus gives it a different growth trajectory than consumer-focused cryptocurrencies. The question isn’t whether it can compete with Bitcoin, but whether it can dominate enterprise blockchain solutions,” states enterprise blockchain researcher Dr. Amanda Foster, 2025.
Market Scenarios for $10 Achievement
Several distinct scenarios could enable HBAR to reach $10, each with different probability assessments and timeframe considerations:
- Gradual Enterprise Adoption: Steady growth over 5-7 years through continuous corporate partnerships
- Mass Market Integration: Breakthrough consumer applications driving mainstream adoption
- Regulatory Clarity: Favorable cryptocurrency regulations creating institutional investment waves
- Market Expansion: Overall cryptocurrency market growth lifting all major projects
- Technology Breakthrough: Unique Hedera innovations creating competitive moats
Risk Factors and Limitations
Honest analysis requires acknowledging significant risks that could prevent HBAR from reaching $10. Understanding these limitations helps investors make informed decisions and develop appropriate strategies.
Primary Risk Categories
- Market Saturation: Enterprise blockchain market may be smaller than projected
- Regulatory Challenges: Changing regulations could impact enterprise adoption
- Technological Competition: Traditional blockchain improvements could reduce Hedera’s advantages
- Economic Conditions: Market downturns affecting all cryptocurrency valuations
“While HBAR has exceptional technology, the path to $10 faces the same market reality check that all cryptocurrencies encounter–utility must translate to sustained demand,” warns risk analyst James Patterson, 2025.
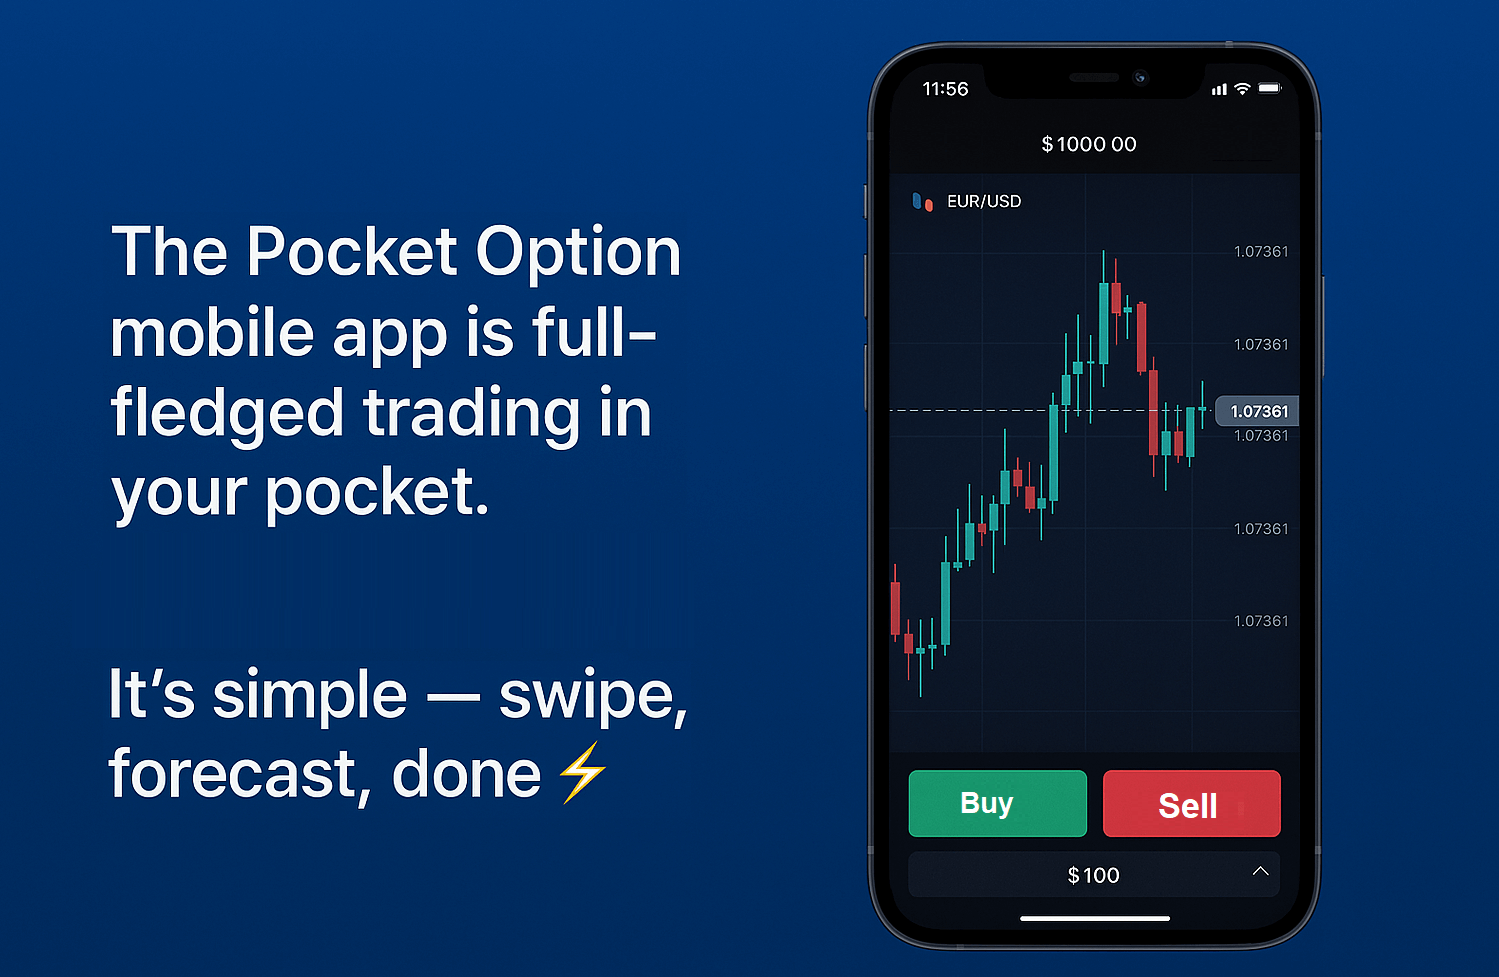
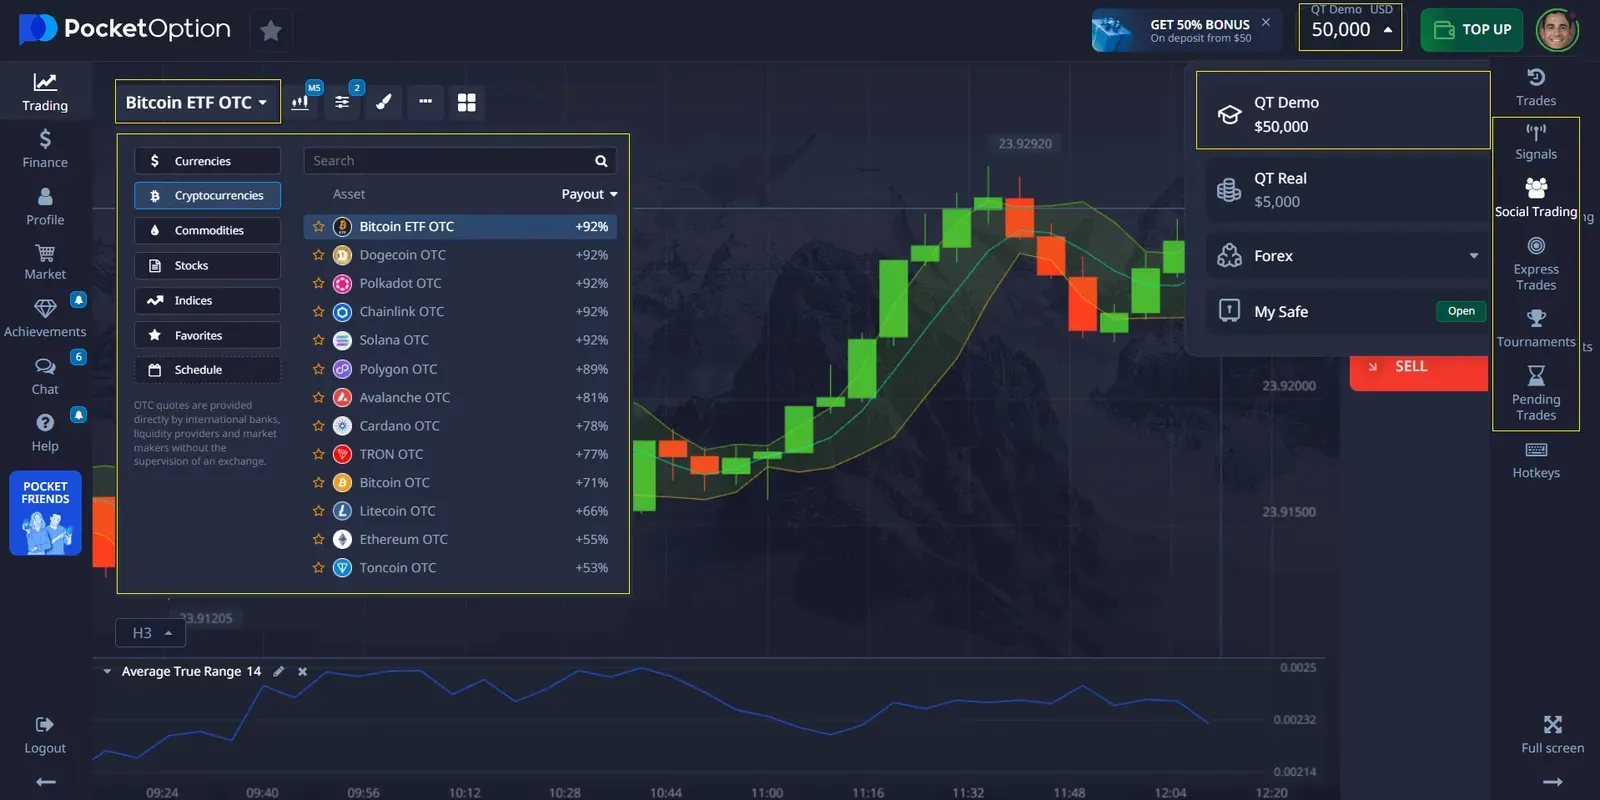
Trading on Pocket Option: Turning Analysis into Action
While in-depth analysis of assets like HBAR is crucial, the right platform is essential to act on your findings. Pocket Option provides a robust environment for traders of all levels, even if a specific asset like HBAR isn’t always available. You can start your trading journey^
- with a minimum deposit of just $5, though this can vary based on your region and payment method.
- you can hone your skills on a free demo account equipped with $50,000 in virtual money.
- The platform boasts over 100 tradable assets, including currencies, commodities, stocks, and other cryptocurrencies, ensuring you always have opportunities to explore.
Furthermore, Pocket Option offers a free and extensive knowledge base with strategies, forex education, and training videos to help you build a solid foundation for your trading career. Regular tournaments and other events provide another avenue to test your skills and earn rewards.
🎓 Ready to turn analysis into action? Pocket Option’s free educational resources and massive demo account are your first steps to becoming a trading pro! 🧠
Investment Strategies and Considerations
For investors considering HBAR’s potential journey to $10, several strategic approaches align with different risk tolerances and timeframes. These strategies recognize that reaching such a significant price target requires patience and careful planning.
Traders often employ different approaches when analyzing HBAR on Quick Trading platforms, focusing on both short-term technical patterns and long-term fundamental developments that could support sustained price appreciation.
- Dollar-Cost Averaging: Regular purchases to smooth volatility over extended periods
- Milestone-Based Investing: Increasing positions as specific adoption targets are met
- Diversified Approach: HBAR as part of broader cryptocurrency portfolio
- Technical Analysis: Using chart patterns to optimize entry and exit points
Expert Predictions and Timeline Analysis
Industry experts have provided various timelines for HBAR reaching significant price milestones, with $10 representing the most bullish scenarios. These predictions synthesize technological progress, market conditions, and adoption patterns.
🎯 While experts predict HBAR’s future, you can start building your own trading future today with Pocket Option’s accessible platform and low entry barriers! ✨
“If enterprise adoption continues at current rates and cryptocurrency markets experience another major bull cycle, HBAR reaching $10 becomes mathematically feasible within a 7-10 year timeframe,” projects cryptocurrency strategist Lisa Chang, 2025.
The consensus among analysts suggests that while $10 HBAR represents an ambitious target, the combination of technological superiority, growing enterprise adoption, and potential market expansion creates a pathway where such appreciation becomes possible rather than simply hoped for.
FAQ
How realistic is HBAR reaching $10 in the next 5 years?
HBAR reaching $10 within 5 years would require extraordinary market conditions and adoption rates. Most conservative estimates suggest 7-10 years for such appreciation, assuming continued enterprise growth and favorable market conditions.
What market cap would HBAR need to reach $10?
At current circulating supply levels, HBAR would need approximately $500 billion market capitalization to reach $10, positioning it among the top 3 cryptocurrencies globally.
Which factors most influence HBAR's price potential?
Enterprise adoption rates, regulatory clarity, technological developments, overall cryptocurrency market growth, and competition from other blockchain solutions are the primary factors affecting HBAR's price trajectory.
What are the main risks for HBAR investors?
Primary risks include market volatility, regulatory changes, technological competition, slower-than-expected enterprise adoption, and overall cryptocurrency market conditions affecting all digital assets.
How does HBAR's technology compare to other cryptocurrencies?
HBAR uses hashgraph consensus technology offering faster finality, higher throughput, and better energy efficiency than traditional blockchains, though it operates in a more centralized governance model.
Should HBAR be considered a long-term investment?
HBAR's enterprise focus and technological advantages make it more suitable for long-term investment strategies, though investors should maintain diversified portfolios and risk management practices.
How can investors track HBAR's progress toward $10?
Key metrics include enterprise partnership announcements, daily transaction volumes, network utilization rates, staking participation, and relative performance against cryptocurrency market benchmarks.
What role does staking play in HBAR's price potential?
Staking reduces circulating supply while providing yield incentives for long-term holders, potentially creating supply constraints that support price appreciation during periods of increased demand.
CONCLUSION
The question of whether HBAR will reach $10 ultimately depends on the convergence of technological excellence, market conditions, and adoption timing. While the mathematical requirements are substantial, HBAR's unique position in enterprise blockchain solutions provides a foundation that distinguishes it from purely speculative cryptocurrencies. The analysis reveals that HBAR's journey to $10 represents more than simple price appreciation—it requires capturing significant market share in the growing enterprise blockchain sector while maintaining technological advantages over emerging competitors. The combination of proven utility, growing enterprise adoption, and strong technical fundamentals creates a compelling case for potential long-term appreciation. For investors considering HBAR's potential, the key lies in understanding that reaching $10 requires patience, market expansion, and continued technological leadership. While no price target is guaranteed in cryptocurrency markets, HBAR's enterprise focus and technological capabilities position it as one of the more fundamentally sound long-term cryptocurrency investments.
Start tradingAbout the author :
Markets
Sign up for more like this
Customize your newsfeed with content you're actually interested in — get up-to-date personalized newsletter in your inbox.
Your comment
Comments are pre-moderated to ensure they comply with our blog guidelines.