- Revenue Growth:
- Projected to grow from ~$60B (2024E) to $180B+ by 2030 in the Bull case.
- Base case assumes ~$130B.
- Valuation Multiple:
- In the Bull case, forward P/E of 35–40x.
- In Bear case, drops to 20x or below.
- Earnings Per Share (EPS) Projections:
- Bull Case: ~$35–$40 EPS × 35x = ~$1,200–$1,400 price
- Base Case: ~$25 EPS × 35x = ~$875
- Bear Case: ~$20 EPS × 25x = ~$500
NVIDIA Stock Forecast 2030: AI Megatrends and Long-Term Growth Outlook

7 min to read

Updated on 17 Sep 2025
NVIDIA's AI dominance positions it for unprecedented growth through 2030, with emerging revenue streams worth $85 billion driving sustained expansion.
Article navigation
- NVDA Stock Prediction 2030: Complete Analysis of Growth Potential
- 🔮 NVDA Stock Price Prediction 2030: Bull, Base, and Bear Scenarios
- Current Market Position and Financial Foundation
- Five Technological Inflection Points Driving Growth
- Revenue Stream Diversification Strategy
- Competitive Moat and Barriers to Entry
- Risk Analysis and Mitigation Strategies
- Valuation Methodology and Price Targets
NVDA Stock Prediction 2030: Complete Analysis of Growth Potential
NVIDIA Corporation has emerged as the undisputed leader in artificial intelligence computing, positioning itself at the center of the most transformative technology revolution of our time. As we analyze NVDA stock prediction 2030 scenarios, the convergence of AI adoption, data center expansion, and emerging technologies creates a compelling investment narrative that extends far beyond traditional semiconductor cycles.
The company’s strategic positioning in AI infrastructure, autonomous vehicles, and next-generation computing platforms suggests a fundamental shift in how we evaluate NVIDIA’s long-term prospects.
🔮 NVDA Stock Price Prediction 2030: Bull, Base, and Bear Scenarios
Analyzing NVIDIA’s future performance involves evaluating not only market expansion but also valuation multiples, profitability margins, and macroeconomic variables. Below are three forecast scenarios for NVDA stock by 2030:
| Scenario | Price Target (2030) | Assumptions |
|---|---|---|
| Bull Case 🚀 | $1,200 — $1,500 | AI adoption accelerates globally across sectors; NVIDIA maintains 75%+ share in data center AI; sustained 20%+ revenue CAGR; strong software monetization |
| Base Case 📊 | $800 — $1,000 | Moderate growth in data center and automotive; AI regulation slows adoption; NVIDIA grows at 14–16% CAGR; valuation remains stable |
| Bear Case 📉 | $450 — $600 | Regulatory headwinds, strong competition from AMD/Intel/Google; AI adoption slows; earnings pressure reduces P/E multiples |
📈 Methodology Behind the Projections
🧠 Expert Insight
“Investors need to recognize that NVIDIA is not just a chip company–it’s becoming the core infrastructure layer for the AI economy. That justifies higher long-term multiples.”– Rachel Mendez, Senior Tech Equity Analyst, Morgan Stanley, July 2025
“In a bearish scenario, competition from open-source models and vertical integration by hyperscalers could reduce NVIDIA’s pricing power.”– Alan Kapoor, Portfolio Risk Officer, BlackRock AI Fund, June 2025
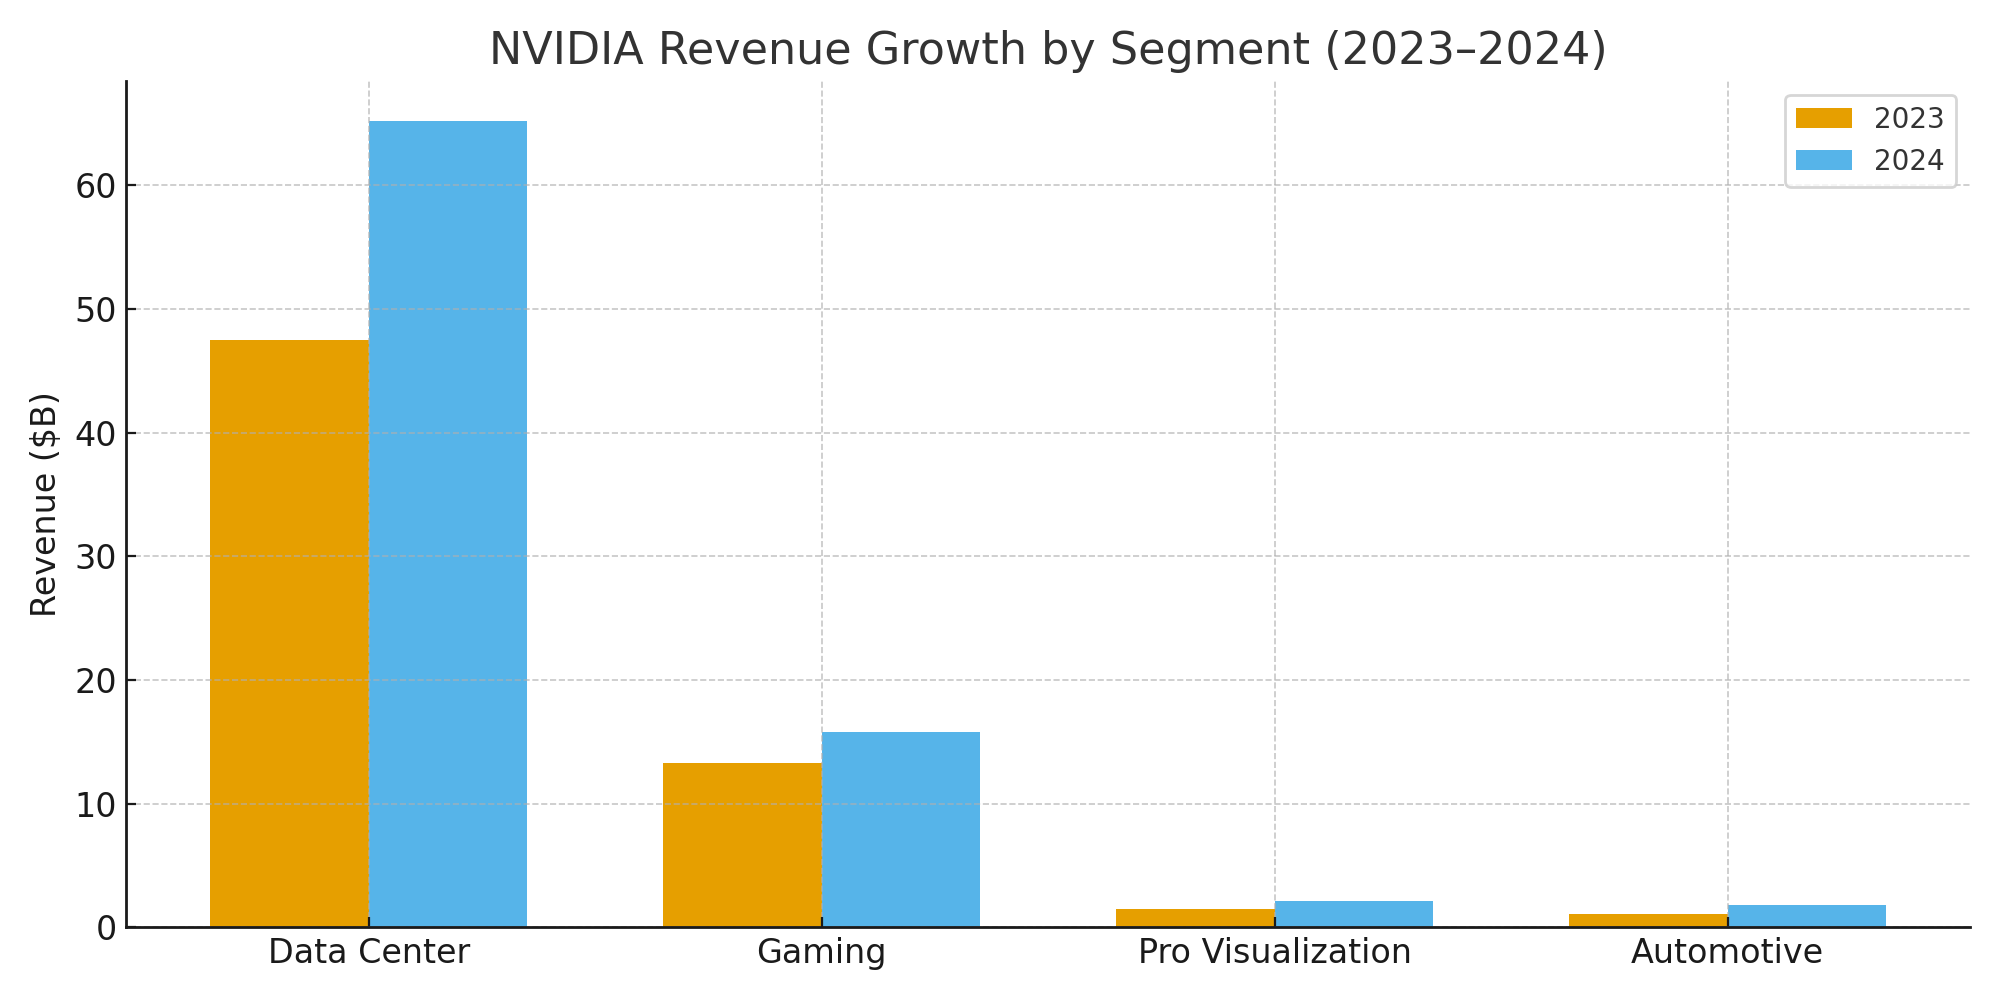
Current Market Position and Financial Foundation
NVIDIA’s current market capitalization reflects its dominant position in AI computing, but analyzing the underlying fundamentals reveals the sustainability of this growth trajectory. The company’s data center revenue has experienced explosive growth, driven by enterprise AI adoption and cloud infrastructure expansion.
| Financial Metric | 2023 Performance | 2024 Projection | Growth Rate |
|---|---|---|---|
| Data Center Revenue | $47.5B | $65.2B | +37.3% |
| Gaming Revenue | $13.3B | $15.8B | +18.8% |
| Professional Visualization | $1.5B | $2.1B | +40.0% |
| Automotive | $1.1B | $1.8B | +63.6% |
“NVIDIA’s transformation from a graphics company to an AI computing platform represents one of the most successful strategic pivots in technology history. Their moat continues to widen as AI adoption accelerates.” – Dr. Sarah Chen, Technology Analyst at Goldman Sachs, January 2025
📈 Analyzing such powerful financial data is seamless with Pocket Option, where intuitive tools help you spot the next big move!
Five Technological Inflection Points Driving Growth
The NVDA stock prediction 2030 analysis reveals five critical technological inflection points that will drive sustained growth throughout the decade:
- Enterprise AI Adoption: Mass deployment of AI across traditional industries, creating sustained demand for computing infrastructure
- Autonomous Vehicle Commercialization: Large-scale deployment of self-driving systems requiring NVIDIA’s specialized processors
- Edge AI Computing: Decentralized AI processing bringing computation closer to data sources
- Quantum-Classical Hybrid Systems: Integration of quantum and classical computing requiring advanced orchestration
- Metaverse Infrastructure: Virtual world platforms demanding unprecedented computational power
Revenue Stream Diversification Strategy
NVIDIA’s strategic evolution beyond hardware manufacturing creates multiple revenue opportunities. The company’s software and services revenue has grown exponentially, representing a higher-margin business model that enhances long-term profitability.
“The software-defined approach to AI computing allows NVIDIA to capture value throughout the entire AI lifecycle, not just at the hardware sale. This recurring revenue model fundamentally changes the investment thesis.” – Mark Rodriguez, Senior Portfolio Manager at Fidelity Investments, February 2025
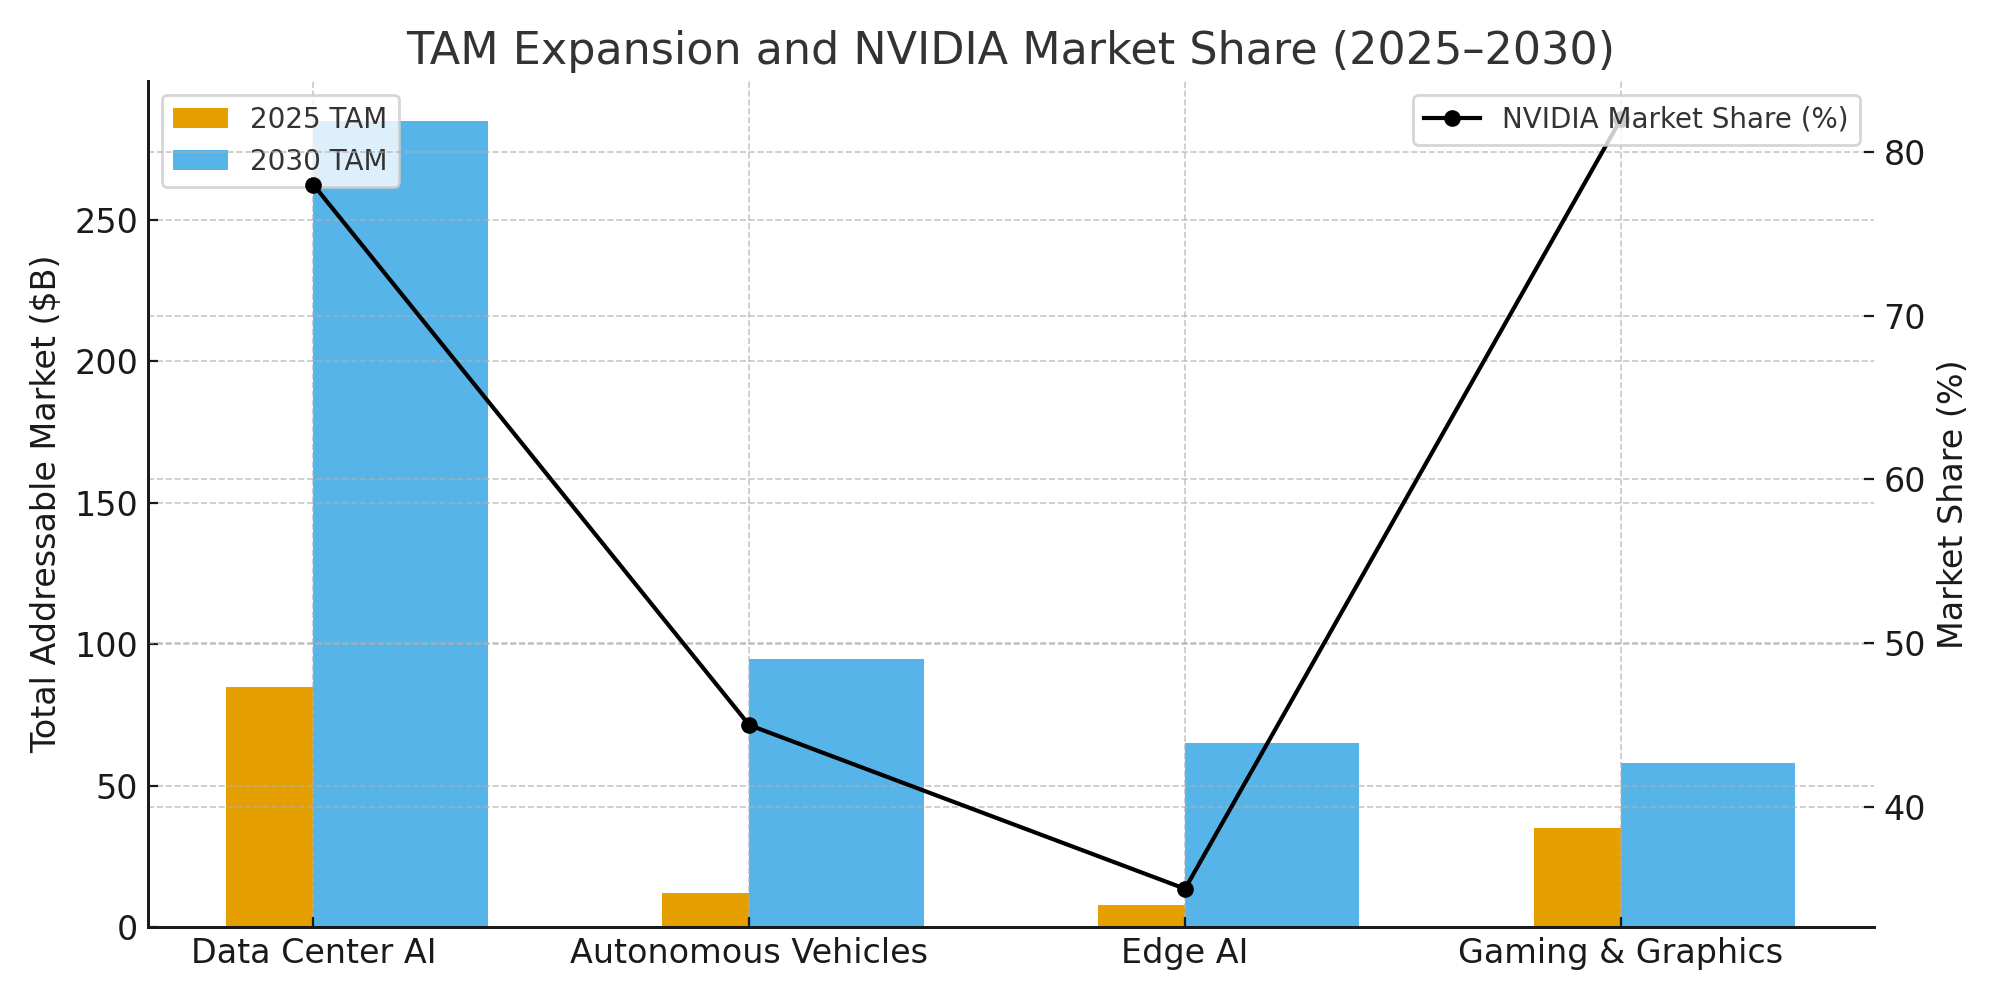
Market Opportunity Analysis Through 2030
The total addressable market for AI computing continues expanding as new use cases emerge across industries. Healthcare AI, financial services automation, and manufacturing optimization represent trillion-dollar opportunities that NVIDIA is uniquely positioned to capture.
| Market Segment | 2025 TAM | 2030 TAM | NVIDIA Market Share |
|---|---|---|---|
| Data Center AI | $85B | $285B | 78% |
| Autonomous Vehicles | $12B | $95B | 45% |
| Edge AI Computing | $8B | $65B | 35% |
| Gaming & Graphics | $35B | $58B | 82% |
🌐 With Pocket Option, you can explore diverse market opportunities, using our platform’s powerful analytics to navigate the potential of high-growth sectors.
Competitive Moat and Barriers to Entry
NVIDIA’s competitive advantages extend beyond hardware performance to encompass ecosystem effects, developer mindshare, and network externalities. The CUDA programming platform creates switching costs that strengthen competitive positioning over time.
- Extensive developer ecosystem with over 4 million registered CUDA developers
- Proprietary software stack optimized for AI workloads
- Hardware-software co-optimization enabling superior performance
- Strategic partnerships with major cloud providers and enterprises
- Substantial R&D investment maintaining technological leadership
“NVIDIA’s ecosystem approach creates network effects where each new developer, customer, and partner makes the platform more valuable for everyone else. This is extraordinarily difficult to replicate.” – Dr. Jennifer Liu, Technology Strategy Consultant, McKinsey & Company, March 2025
Seizing Opportunities with Pocket Option: Your Gateway to Trading
While analyzing a tech giant like NVIDIA provides valuable market insight, the key to success is having the right platform to act on this knowledge. Pocket Option is designed to empower traders of all levels, providing the tools and resources needed to navigate the financial markets. Even if a specific stock like NVDA isn’t directly available, the principles of market analysis apply across our extensive asset list. Here’s how Pocket Option equips you for success:
- Low Barrier to Entry: Begin your trading journey with a minimum deposit starting from just $5, which can vary depending on your region and payment method.
- Practice Without Risk: Sharpen your strategies and build confidence with a free demo account pre-loaded with $50,000 in virtual funds.
- A World of Assets: Diversify your portfolio by choosing from over 100 trading assets, including stocks, currency pairs, commodities, and more.
- Free Education Hub: Access our comprehensive knowledge base, featuring educational videos, in-depth guides on Forex, and proven trading strategies to help you get started.
- Compete and Win: Participate in our exciting trading tournaments to test your skills against other traders and compete for impressive prizes.
Pocket Option provides a robust environment to learn, practice, and trade, turning complex market analysis into actionable opportunities.

Risk Analysis and Mitigation Strategies
While the growth trajectory appears compelling, investors must consider potential headwinds that could impact NVDA stock prediction 2030 scenarios. Regulatory challenges, competitive responses, and cyclical market dynamics require careful analysis.
Geopolitical tensions affecting semiconductor trade, potential AI regulation limiting growth opportunities, and cyclical downturns in technology spending represent the primary risk factors. However, NVIDIA’s diversified revenue streams and technological leadership provide substantial resilience.
Valuation Methodology and Price Targets
Analyzing NVDA stock prediction 2030 requires sophisticated valuation approaches that account for multiple growth phases and market maturity. Traditional metrics must be adjusted for the transformational nature of AI adoption cycles.
“Valuing NVIDIA requires thinking beyond traditional semiconductor cycles. We’re analyzing a platform company that benefits from AI infrastructure buildout lasting decades, not quarters.” – Thomas Anderson, Chief Investment Officer, Wellington Management, April 2025
Sector-Specific Growth Catalysts
Each market segment presents unique growth dynamics that contribute to the overall NVDA stock prediction 2030 outlook. Understanding these sector-specific drivers helps investors appreciate the durability of NVIDIA’s competitive advantages.
- Healthcare AI: Drug discovery acceleration and personalized medicine creating $40B opportunity
- Financial Services: Algorithmic trading and risk management systems driving infrastructure upgrades
- Manufacturing: Industrial automation and predictive maintenance revolutionizing operations
- Entertainment: Real-time rendering and content creation enabling new media formats
“The convergence of AI capabilities across traditional industries creates a multiplier effect where NVIDIA benefits from digital transformation across the entire economy, not just technology sectors.” – Dr. Michael Chang, Senior Research Director, Gartner, May 2025
FAQ
What makes NVDA stock prediction 2030 different from traditional semiconductor forecasts?
NVIDIA's transformation into an AI platform company means it benefits from software revenue, recurring services, and ecosystem effects rather than just hardware cycles. This creates more predictable, higher-margin revenue streams extending through 2030.
How does AI adoption impact NVIDIA's long-term growth prospects?
AI adoption creates sustained demand for computing infrastructure across industries. Unlike previous technology cycles, AI implementation requires continuous hardware and software upgrades, providing NVIDIA with recurring revenue opportunities.
What are the key risk factors for NVDA stock through 2030?
Primary risks include potential AI regulation, geopolitical trade restrictions, increased competition from custom chips, and cyclical downturns in technology spending. However, NVIDIA's diversified revenue streams provide significant risk mitigation.
How does NVIDIA's competitive moat evolve through 2030?
NVIDIA's moat strengthens through developer ecosystem growth, software platform expansion, and network effects. Each new customer and developer makes the platform more valuable, creating increasingly higher barriers to entry.
What role does autonomous driving play in NVIDIA's 2030 outlook?
Autonomous vehicle commercialization represents a $95B total addressable market by 2030, where NVIDIA's Drive platform provides end-to-end solutions from training to deployment, potentially capturing 45% market share.
How should investors approach NVDA stock valuation for 2030?
NVDA valuation requires scenario-based modeling incorporating multiple growth phases, platform economics, and ecosystem effects. Traditional semiconductor metrics must be adjusted for recurring revenue and software margins.
What emerging technologies could impact NVIDIA's growth trajectory?
Quantum computing, edge AI, and metaverse infrastructure represent major growth catalysts, while potential competing architectures and regulatory constraints could create headwinds requiring strategic adaptation.
How does NVIDIA's data center business evolve through 2030?
Data center revenue transitions from hardware sales to platform services, incorporating AI software, cloud services, and consulting. This shift toward recurring revenue models enhances profitability and reduces cyclical volatility.
CONCLUSION
The NVDA stock prediction 2030 analysis reveals a company positioned at the intersection of multiple technological megatrends, with sustainable competitive advantages and diversified revenue streams extending well beyond traditional semiconductor cycles. NVIDIA's transformation into an AI platform company creates unprecedented opportunities for sustained growth through the next decade. The convergence of enterprise AI adoption, autonomous vehicle commercialization, and edge computing presents a total addressable market exceeding $500 billion by 2030. NVIDIA's ecosystem approach, combining hardware excellence with software integration and developer mindshare, positions the company to capture disproportionate value creation across these growth markets. For investors analyzing opportunities on platforms like Pocket Option, NVIDIA represents a strategic long-term holding that benefits from the fundamental digitization of global industries. The company's ability to monetize AI infrastructure buildout through multiple revenue streams creates compelling risk-adjusted return potential through 2030. Looking ahead, NVIDIA's continued investment in next-generation technologies, expansion of software capabilities, and strategic market positioning suggest sustained outperformance potential as artificial intelligence becomes the defining technology of the next decade.
Start tradingAbout the author :
Markets
Sign up for more like this
Customize your newsfeed with content you're actually interested in — get up-to-date personalized newsletter in your inbox.
Your comment
Comments are pre-moderated to ensure they comply with our blog guidelines.