- Weather Patterns: A 5°F decrease in winter temperatures can increase Natural Gas consumption by up to 15%, dramatically affecting prices. The 2021 Texas freeze sent prices soaring from $3 to over $23 per MMBtu in some regions.
- Production Disruptions: Hurricane shutdowns in the Gulf of Mexico can reduce production by 2-3 billion cubic feet per day, creating supply concerns.
- Storage Levels: The five-year average inventory benchmark serves as a critical price indicator–when current storage falls below this average, prices typically rise.
- Cross-Commodity Relationships: Natural Gas often moves inversely to crude oil prices, particularly when considering substitution effects in industrial applications.
Natural Gas: Understanding and Trading This Essential Energy Asset

Updated on 23 Apr 2025
Natural Gas represents a critical global energy resource with significant trading volume. This article explores Natural Gas fundamentals, market mechanics, and practical trading approaches. Here you'll find actionable information to help you make informed decisions about how to trade Natural Gas.
Article navigation
What is Natural Gas?
Natural Gas is a combustible fossil fuel consisting primarily of methane (CH₄), used extensively for heating, electricity generation, and as a feedstock in manufacturing. Unlike crude oil, Natural Gas is primarily valued for its direct energy applications. It occurs in underground reservoirs and requires specialized infrastructure for extraction and transportation–either via extensive pipeline networks or as liquefied natural gas (LNG) for overseas shipping. Traders typically access Natural Gas markets through futures contracts on exchanges like NYMEX, specialized ETFs like UNG, or through CFDs offered by brokers.
How Does the Natural Gas Price Mechanism Work?
Natural Gas pricing operates on standard supply-demand economics, with prices quoted per million British thermal units (MMBtu). When you see “$3.50/MMBtu” on trading platforms, this indicates the cost for energy equivalent to burning approximately 1,000 cubic feet of gas. Price volatility typically increases during peak demand seasons–heating demand spikes prices between November and March in the Northern Hemisphere, while summer air conditioning needs can impact electricity generation demand.
Key price-moving events include the weekly EIA Natural Gas Storage Report (released Thursdays), which causes immediate market reactions based on inventory changes. For instance, a storage draw larger than analyst expectations typically triggers price increases, while smaller-than-expected withdrawals often lead to price declines.
Factors Influencing Natural Gas Price Movements
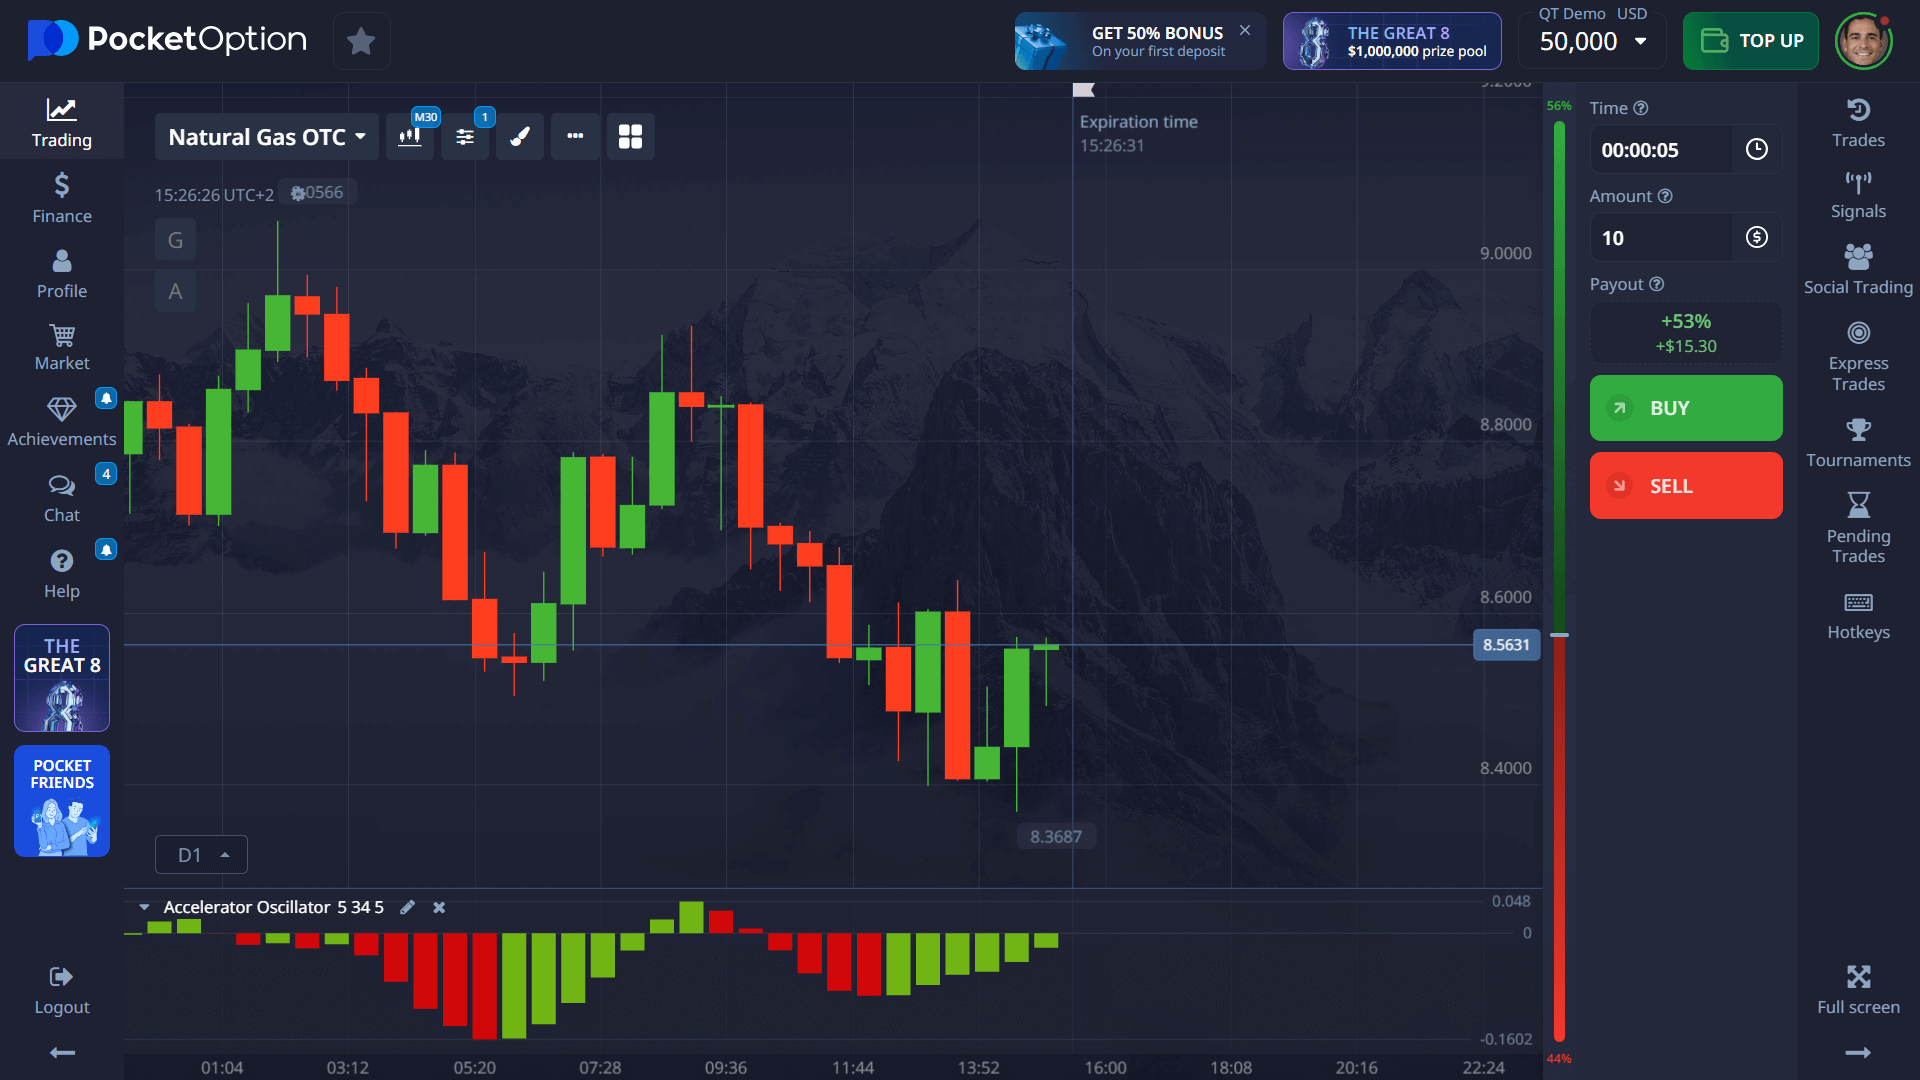
How to Read Natural Gas Price Charts
Effective Natural Gas chart analysis requires understanding specific market patterns. The commodity frequently forms double tops and bottoms, creating reliable reversal signals. Key technical levels to monitor include the psychological $3.00/MMBtu threshold and the 200-day moving average, which often serves as significant support/resistance.
Seasonal price patterns show Natural Gas typically gaining 15-20% between September and December as winter heating demand approaches. For example, a move from $3.50 to $4.20 per MMBtu during this period would align with historical seasonal strength. Understanding these patterns helps identify potential entry and exit points for trades.
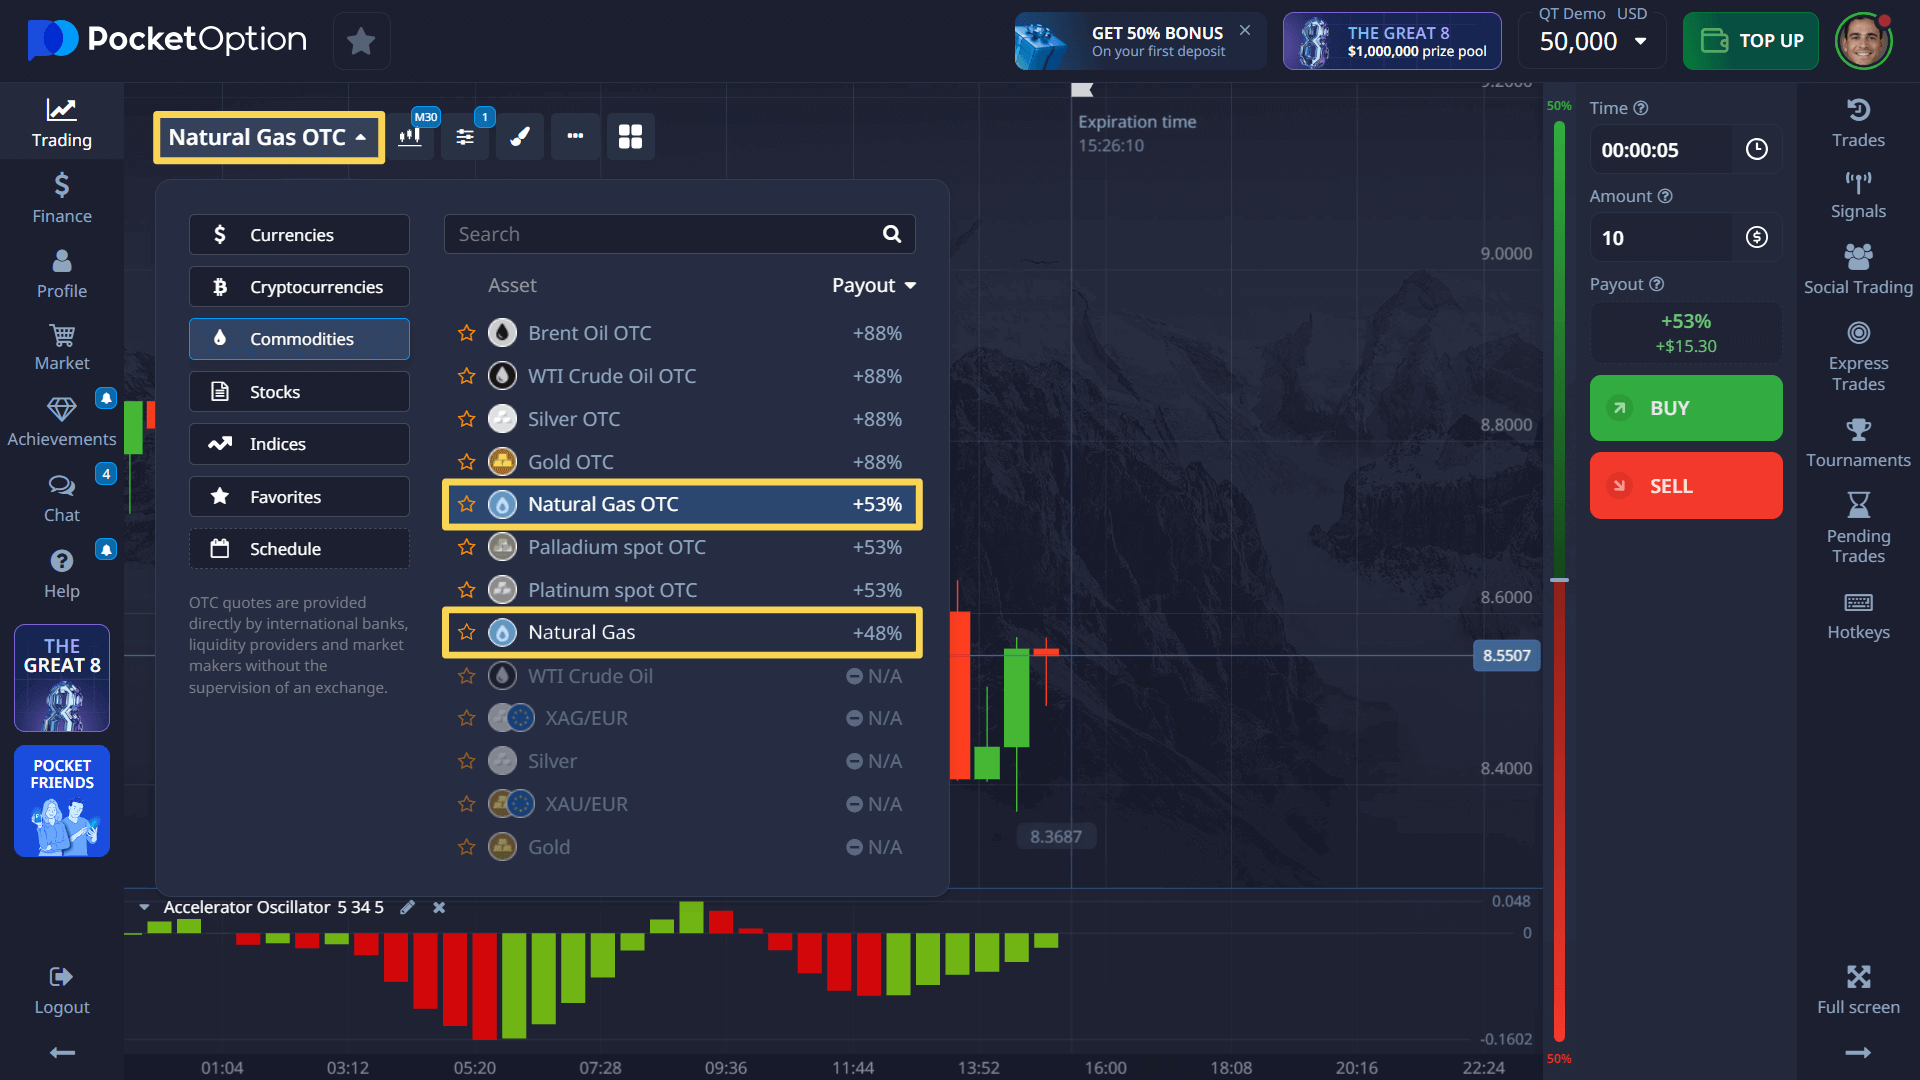
How to Buy Natural Gas: Step-by-Step Approach
- Locate Natural Gas Assets: Navigate to the asset selection menu and search for “Natural Gas” or “Natural Gas OTC” for extended-hours trading availability.
- Analyze Market Conditions: Apply technical indicators like Relative Strength Index (RSI) and Moving Average Convergence Divergence (MACD) to identify potential entry points.
- Set Position Size: Start with 1-2% of your trading capital per position to manage risk effectively while learning.
- Select Trade Duration: Natural Gas exhibits both intraday volatility (5-minute to 1-hour positions) and longer-term trends (daily or weekly positions).
- Execute Your Strategy: Based on your market analysis, select BUY for anticipated price increases or SELL for expected declines.
- Manage Your Position: Set realistic profit targets (typically 8-12% for short-term trades) and implement stop-loss protection.
How to Invest in Natural Gas for Long-Term Growth
For traders wondering how to invest in Natural Gas beyond day trading, we offer to consider Natural Gas ETFs that track prices without the complexity of futures contracts. These investment vehicles offer simplified exposure to price movements while eliminating concerns about contract rollovers and delivery specifications that futures traders must manage.
Another approach includes investing in Natural Gas infrastructure companies that provide more stable returns through midstream operations like pipelines and storage facilities, which generate revenue regardless of short-term price fluctuations.
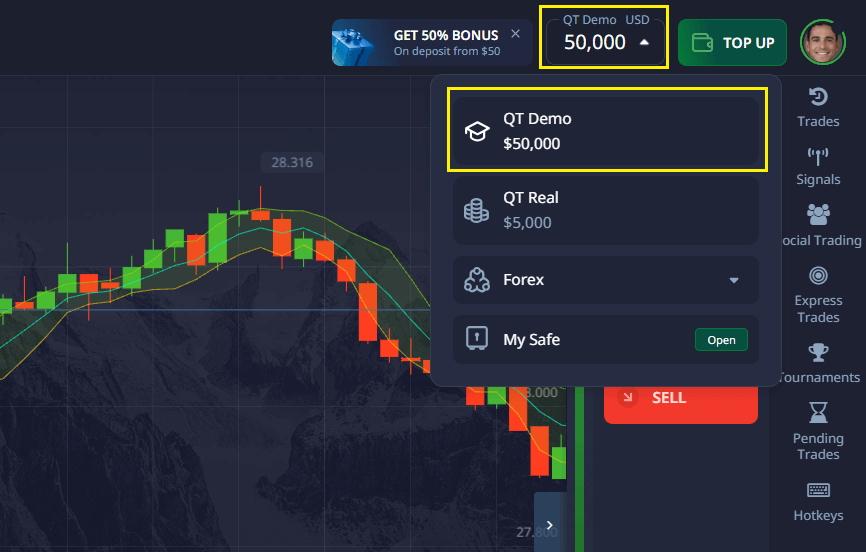
Try Trading Without Risk — $50,000 Demo Account
Before committing real capital, utilize the $50,000 practice environment to test Natural Gas trading strategies. This simulation replicates actual market conditions, allowing you to experience price volatility and test technical analysis tools without financial exposure. The demo environment provides an excellent opportunity to understand how events like storage reports affect prices and to practice timing entries and exits based on chart patterns.
Once comfortable with the mechanics and price behavior, transition to live trading with a minimum $5 deposit. This gradual approach helps build confidence while minimizing early mistakes that often plague new commodity traders.
FAQ
How can I start trading Natural Gas?
Begin by opening an account with a broker offering Natural Gas CFDs, futures, or ETFs. Use a demo account to practice your strategy, then start with small position sizes when transitioning to real money trading. Focus on understanding price drivers like weather reports and storage data.
What factors influence the price of Natural Gas?
Natural Gas prices respond primarily to weather patterns (heating/cooling demand), storage inventory levels, production disruptions, pipeline capacity constraints, and broader economic indicators affecting energy demand. The weekly EIA storage report on Thursdays frequently triggers significant price movements.
How do I read a Natural Gas price chart?
Natural Gas charts display price action over time. Focus on key support/resistance levels (particularly around $3.00, $4.00, and $5.00 MMBtu), seasonal patterns (typically stronger in winter months), and technical indicators like RSI to identify overbought/oversold conditions. Volume increases often precede major price moves.
How much do I need to start trading Natural Gas?
You can begin trading Natural Gas with as little as $5 on platforms offering micro-contracts or fractional trading. However, for effective risk management, consider having at least $250-500 dedicated to your trading account to withstand normal market volatility.
Can I trade Natural Gas on Pocket Option from anywhere?
Pocket Option offers Natural Gas trading in many jurisdictions, but regulatory restrictions apply in certain countries. Verify availability in your region before registration. Note that trading hours may differ from your local time zone, as Natural Gas futures primarily follow North American trading sessions.
Markets
Sign up for more like this
Customize your newsfeed with content you're actually interested in — get up-to-date personalized newsletter in your inbox.
Your comment
Comments are pre-moderated to ensure they comply with our blog guidelines.