- Identify the trend — Is the market moving up, down, or sideways?
- Read the candle’s story — Are buyers or sellers stronger?
- Look for confirmation from other candlesticks, technical indicators, and chart patterns.
How to Read Candlesticks for Better Trading: Understanding Candlestick Charts

7 min to read
Updated on 19 Aug 2025
In trading, mastering how to read candlesticks is the fastest way to spot winning opportunities. 📊 On Pocket Option, you can apply these skills instantly — trading 100+ assets 24/7, starting from just $5, or practicing risk-free on a $50,000 demo account.
Article navigation
- Components of a Candlestick
- How to Read Candlesticks for Trading Success
- Common Candlestick Patterns
- Reversal vs Continuation Patterns
- Pocket Option: How to Set Up Candlestick Charts
- Tips for Beginners
- Candlesticks in Crypto vs Stocks
- Example Trade Using Candlesticks on Pocket Option
- Why Candlestick Reading Matters
Want to practice candlestick charts?
Educational materials and a free demo account from Pocket Option will help you with this
What Are Candlestick Charts?
Candlestick charts are a core tool in technical analysis. They show the price action for a specific time period in a visually intuitive way — with each candlestick containing the open, close, high, and low prices. Compared to line charts or bar charts, candlestick charts are more detailed and easier to interpret, especially when spotting chart patterns and trading signals. Nore about candles here.
| Element | Description |
|---|---|
| Candle Body | Shows the range between the opening and closing prices. |
| Wicks / Shadows | Represent the highest and lowest price reached in that period. |
| Color | Green (bullish) if close > open, red (bearish) if close < open. |
Components of a Candlestick
Each candlestick consists of two main parts: the body and the wicks (or shadows). Understanding them is essential for accurate chart analysis.
| Component | Insight |
|---|---|
| Body | Long body = strong momentum. Short body = indecision (often a doji). |
| Upper Wick | Shows the highest price buyers reached before sellers pushed back. |
| Lower Wick | Shows the lowest price sellers reached before buyers stepped in. |
💡 Example: A long lower wick after a downtrend can be a sign of a bullish reversal, as buyers regained control after strong selling pressure.
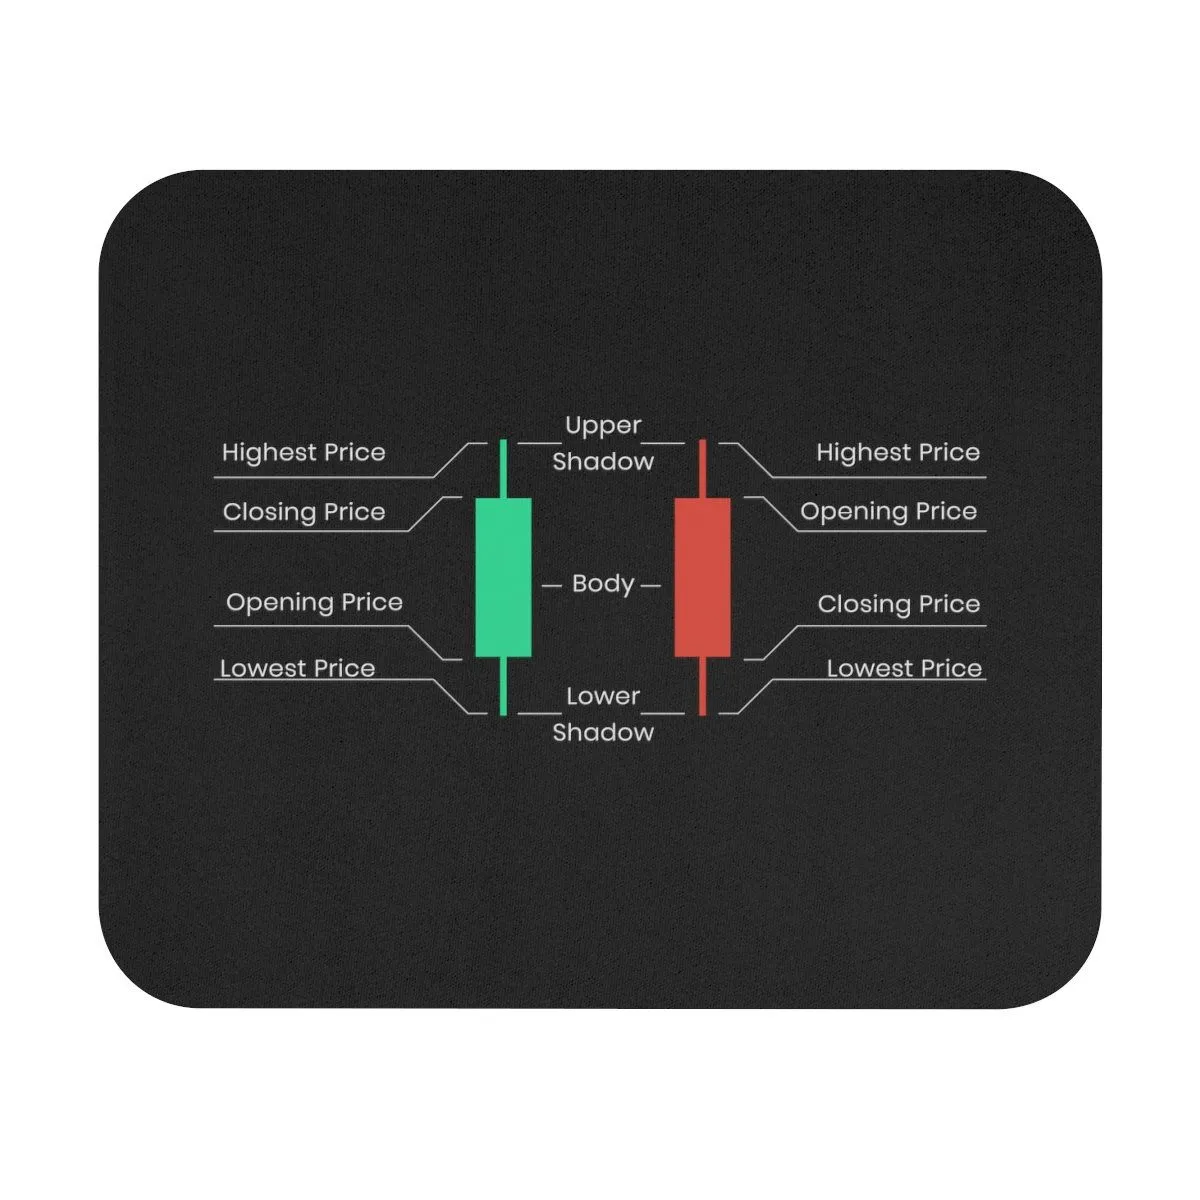
Bullish vs Bearish Candlesticks
The color of the candlestick provides an instant clue to market analysis.
| Type | Color | Meaning |
|---|---|---|
| Bullish | Green or White | Buyers dominated — close > open. |
| Bearish | Red or Black | Sellers dominated — close < open. |
How to Read Candlesticks for Trading Success
Reading candlesticks is more than just identifying colors. A skilled trader analyzes price action by looking at candle size, wick length, and their position in the overall trend.
Steps to reading candlesticks effectively:
Common Candlestick Patterns
Recognizing candlestick patterns is crucial for catching profitable trading signals.
Bullish Patterns (Potential Upward Move)
- Bullish Engulfing → Large green candle fully covers previous red candle — strong buying momentum.
- Hammer → Small body + long lower wick — sellers dominated early, but buyers pushed back.
- Morning Star → Three-candle reversal from bearish to bullish.
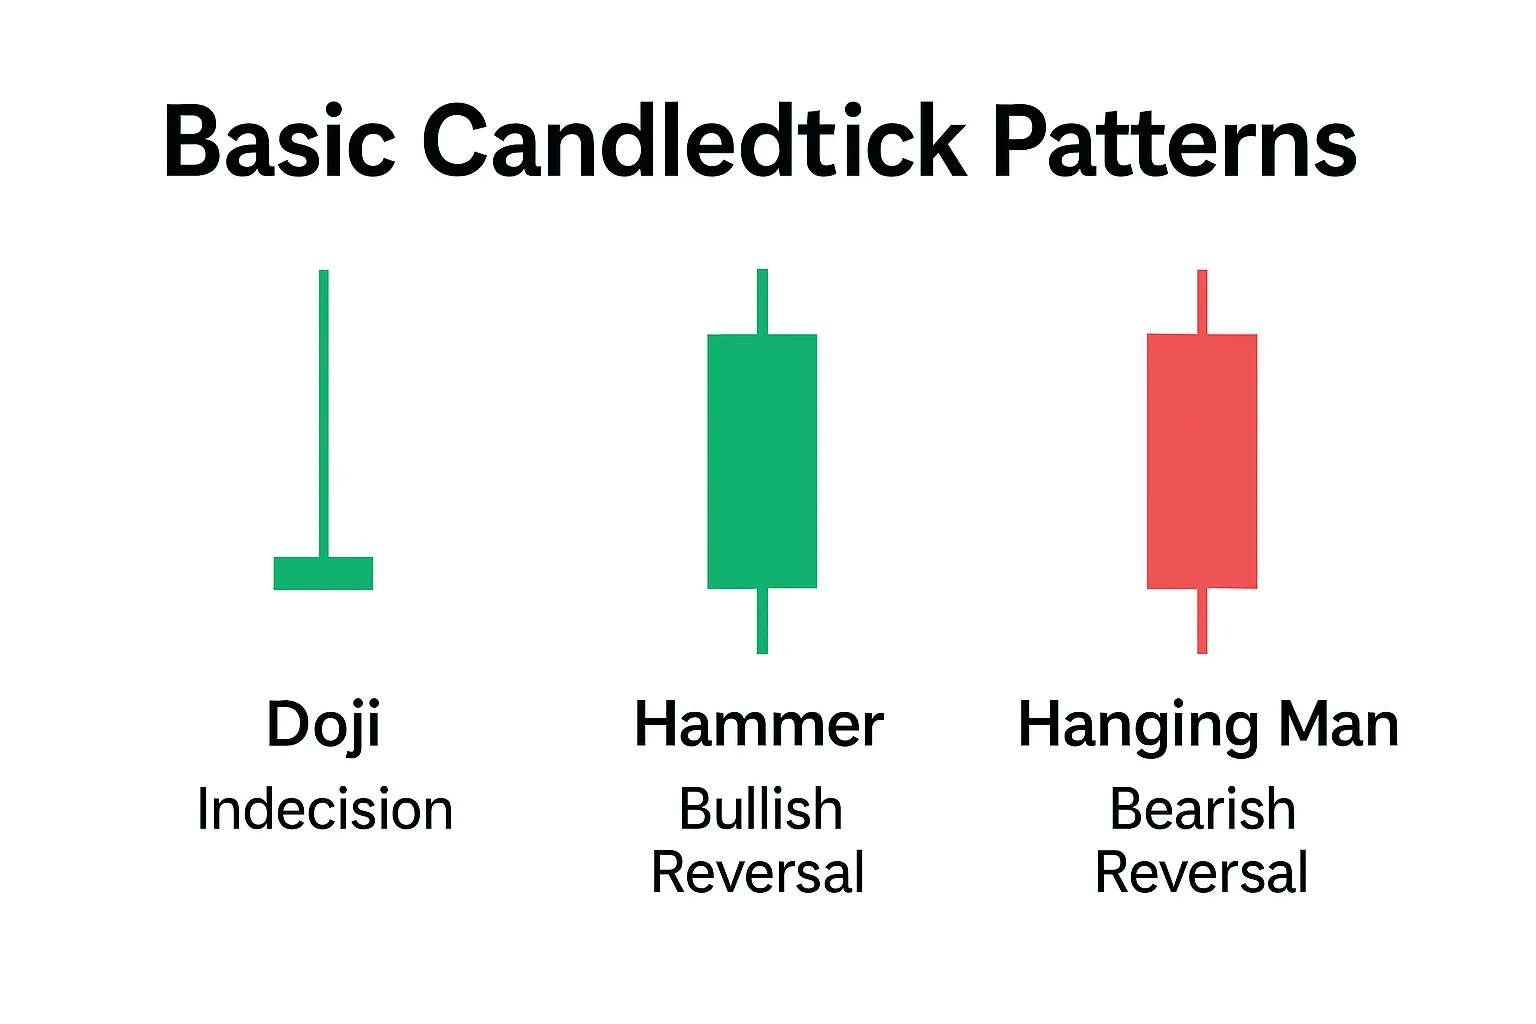
Bearish Patterns (Potential Downward Move)
- Bearish Engulfing → Large red candle fully covers previous green candle — sellers take over.
- Shooting Star → Small body + long upper wick — buyers lost control near the high.
- Evening Star → Three-candle reversal from bullish to bearish.
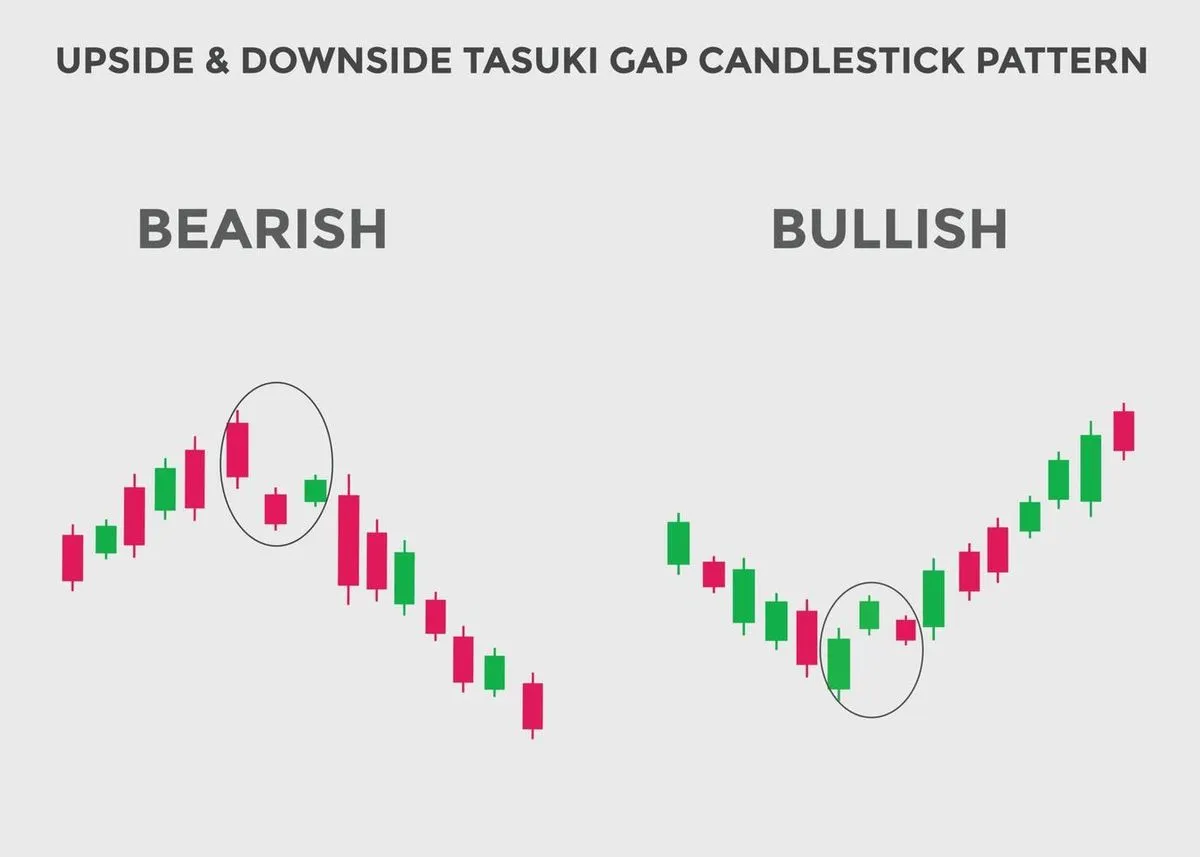
Reversal vs Continuation Patterns
Some chart patterns show a trend is ending (reversal), while others suggest it will continue (continuation).
| Type | Example Patterns |
|---|---|
| Reversal | Morning Star, Evening Star, Hammer, Shooting Star |
| Continuation | Rising Three, Falling Three, Bullish Harami |
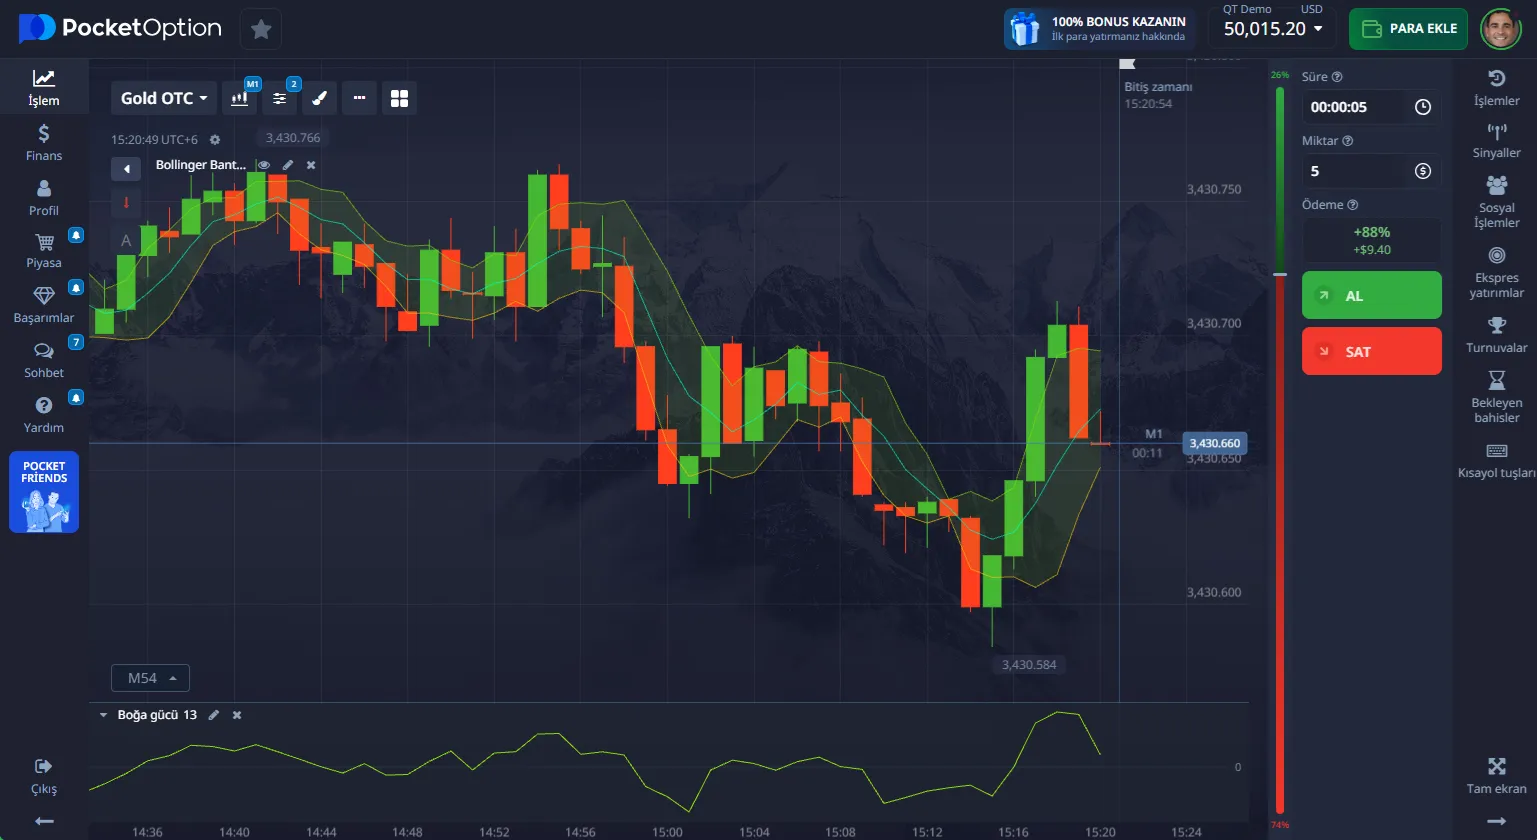
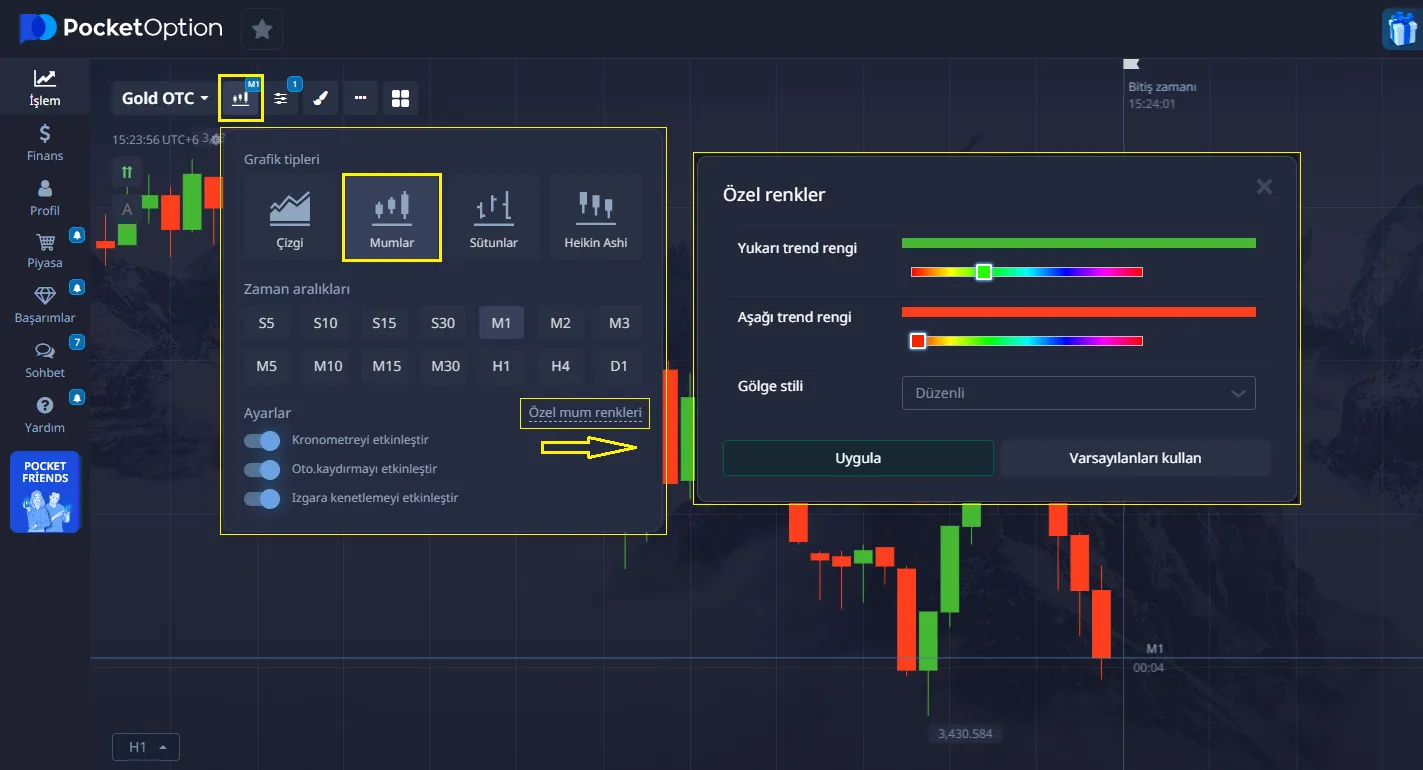
Pocket Option: How to Set Up Candlestick Charts
Pocket Option offers easy customization of Japanese candlesticks, allowing traders to adapt them to their strategy.
- Select Candlestick View
Click on chart type → choose “Candlesticks.” - Pick a Timeframe
From 5 seconds to 1 month — short frames for scalping, longer for swing trading. - Customize Appearance
Change colors, thickness, grid lines, and background. - Add Technical Indicators
Combine candlestick reading with RSI, Moving Averages, or Bollinger Bands.
📌 Pro Tip: Use the demo account to practice reading candlestick charts without risk.
Tips for Beginners
Starting out in trading can feel overwhelming, but mastering how to read candlesticks early will give you a huge edge. Here’s how to set yourself up for success:
Do:
- Learn the most common patterns first. Focus on a handful of high-probability patterns such as the hammer, bullish engulfing, and shooting star. By mastering these before moving to advanced formations, you’ll avoid information overload and start spotting real opportunities faster.
- Use candlesticks with technical indicators for confirmation. A bullish engulfing candle backed by RSI rising above 50, or a moving average crossover, provides stronger trading signals than candlestick analysis alone. This combination reduces false entries.
- Keep risk per trade low. Risking 1–2% of your trading balance per trade can keep you in the game longer, allowing you to learn without blowing your account. Even with accurate candlestick reading, markets can still move unexpectedly.
Avoid:
- Acting on one candle alone. Even the most powerful pattern can fail if it appears in the wrong market context. Always check the preceding price action and confirm with other tools.
- Ignoring overall trend direction. Trading against the trend reduces win probability. If the market is in a strong uptrend, bearish patterns are more likely to fail — and vice versa.
- Overtrading during sideways markets. In ranging markets, many patterns will give conflicting signals. Wait for clear breakouts before making a move.
💡 Pocket Option Tip: Use the demo account to practice these rules without risking real capital. You can replay past market sessions, spot patterns, and test your reactions in real-time simulations.
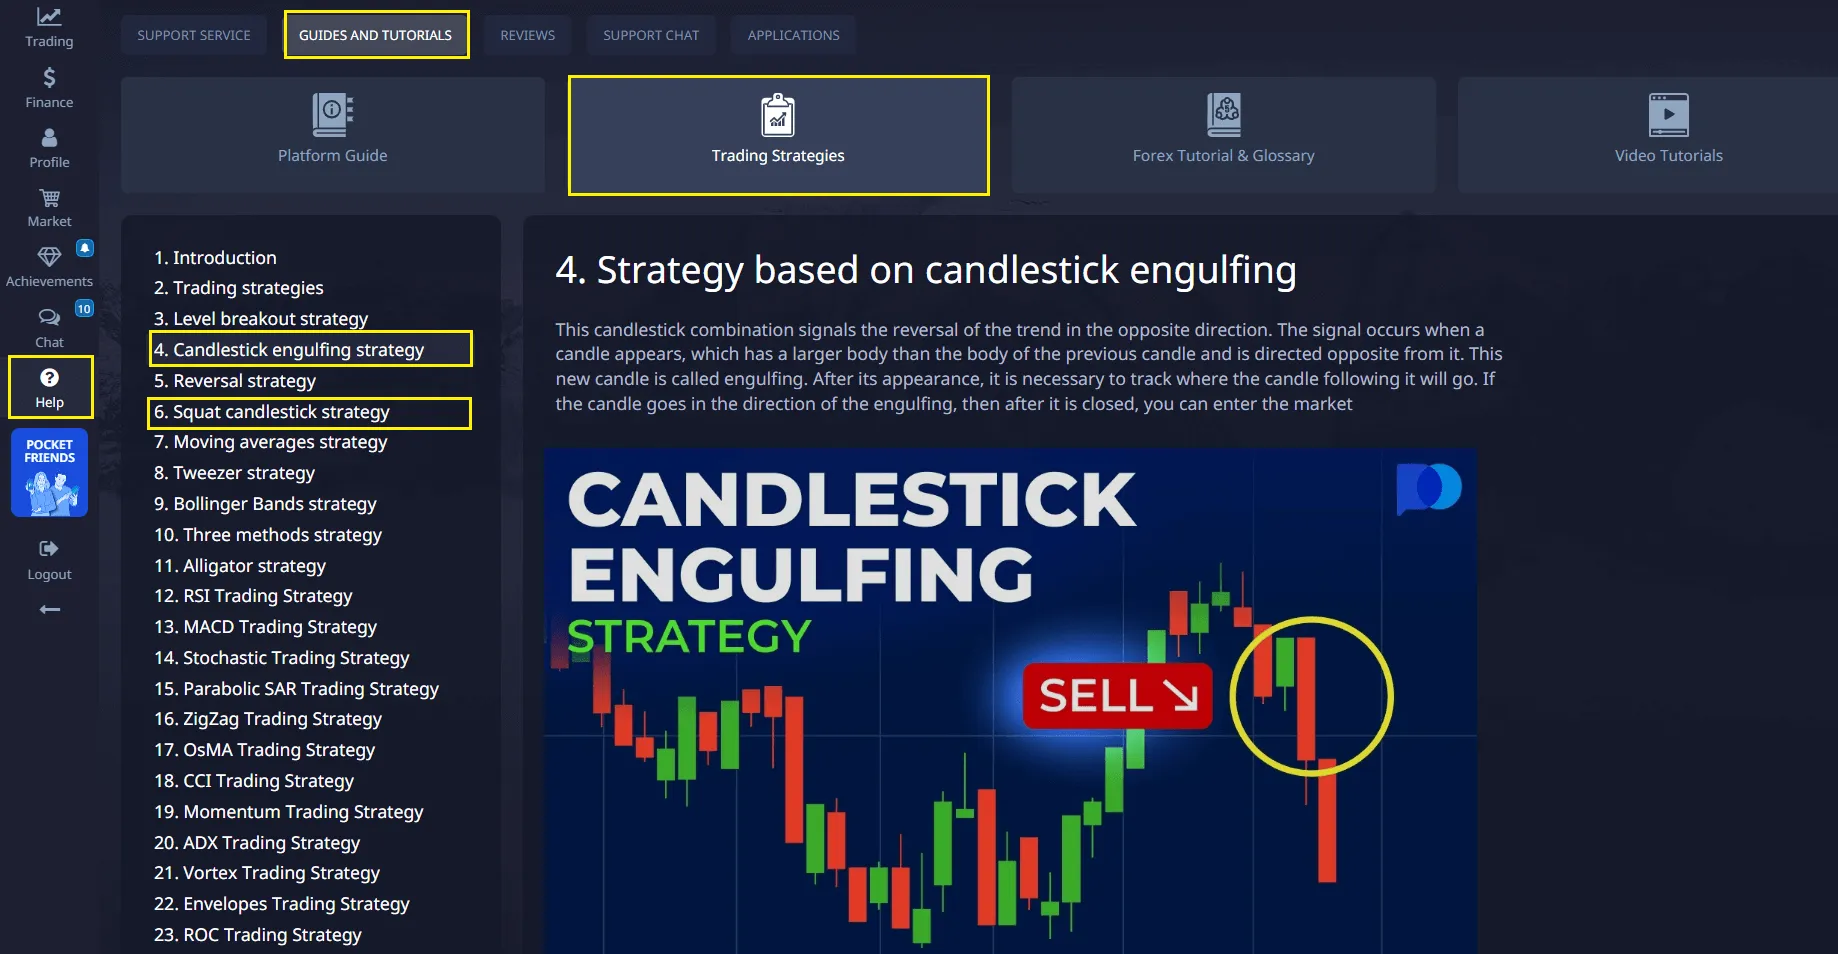
Learn and trade on Pocket Option. Go to the strategy section after registration!
Candlesticks in Crypto vs Stocks
While the fundamentals of chart analysis remain the same, candlestick behavior differs between asset classes.
Stocks:
Stock market candlestick patterns often develop in a more structured way due to fixed trading hours and scheduled news releases. Patterns like morning star or rising three tend to form during predictable periods, such as the first or last hour of the trading day. This makes it easier for traders to plan their setups.
Crypto:
Cryptocurrencies trade 24/7, creating constant price action. This results in:
- More frequent long wicks, especially during low-liquidity hours (late-night or early-morning sessions in major time zones).
- Sudden breakouts or reversals during weekends when traditional markets are closed.
- Patterns that form and resolve much faster, demanding quicker decision-making.
💡 Example: On Bitcoin, a sudden spike from $42,000 to $42,800 followed by a sharp drop back to $42,100 might form a shooting star on the 15-minute chart — signaling heavy selling pressure despite a brief rally.
Pocket Option Advantage: Because Pocket Option offers both stocks and crypto, you can apply the same candlestick patterns across markets, adapting your approach based on volatility and trading hours. The platform’s multi-timeframe charts make it easy to switch from a daily stock chart to a 5-minute crypto chart instantly.
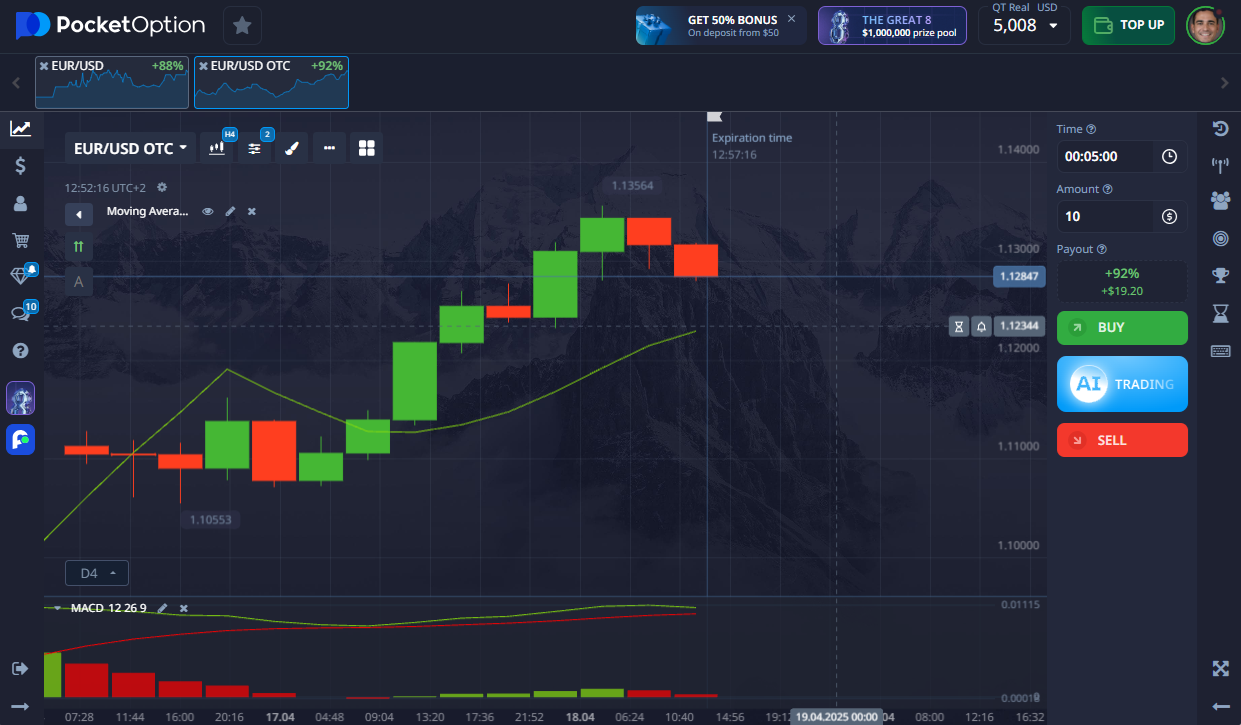
Example Trade Using Candlesticks on Pocket Option
Let’s walk through a practical scenario that combines price action, candlestick patterns, and technical indicators.
Setup:
- Asset: EUR/USD
- Chart Type: Candlesticks
- Timeframe: 5-minute
- Indicators: RSI set to 14
Observation: You notice a bullish engulfing pattern forming after a short downtrend. The RSI, previously below 30, has just crossed above it — a signal of potential bullish momentum.
Execution: On Pocket Option, you enter a 15-minute call option (predicting price will rise) at the close of the engulfing candle.
Outcome: Over the next three candles, the price steadily climbs, reaching a higher close. The trade expires in the money, confirming your analysis.
📌 Lesson: The winning combination here wasn’t the candlestick alone — it was the confluence of:
- Recognizable candlestick pattern.
- Oversold RSI turning bullish.
- Execution on a reliable platform with fast order execution.
Why Candlestick Reading Matters
Candlestick reading is one of the most universal skills in trading because it:
- Works for market analysis across all asset types. From forex pairs to blue-chip stocks to Bitcoin, candlestick patterns reflect the same trader psychology.
- Gives early insight into buying/selling pressure. Wicks, bodies, and colors reveal whether buyers or sellers are in control — often before other indicators show a trend change.
- Fits into almost any technical analysis strategy. Whether you’re trading breakouts, pullbacks, or reversals, candlesticks integrate seamlessly with moving averages, Fibonacci levels, and other tools.
💡 Pro Insight: Professional traders often treat candlesticks as the foundation of their market analysis, layering other tools only for confirmation. On Pocket Option, you can do the same — using Japanese candlesticks alongside dozens of built-in technical indicators to create a highly adaptive trading plan.
FAQ
What do candlestick colors mean?
Green (or white) candles show that the closing price is higher than the opening price (bullish), while red (or black) candles show the closing price is lower than the opening price (bearish).
How read bullish/bearish patterns?
Bullish patterns (e.g., hammer, bullish engulfing) often signal potential upward movement after selling pressure weakens. Bearish patterns (e.g., shooting star, bearish engulfing) suggest possible price drops after buying pressure fades.
Best candlestick patterns trading?
Popular high-probability patterns include the bullish engulfing, hammer, morning star (bullish) and bearish engulfing, shooting star, evening star (bearish).
How combine with other indicators?
Use candlestick patterns alongside technical indicators like RSI, Moving Averages, or MACD for confirmation. For example, a bullish engulfing backed by RSI rising above 50 strengthens the signal.
Common candlestick mistakes avoid?
Relying on a single candle without context, ignoring trend direction, and trading during low-volatility or choppy sideways markets are common errors.
Which timeframe best for candlesticks?
It depends on your style — scalpers may prefer 1–5 minute candles, swing traders often use 1-hour to daily candles, and long-term investors focus on daily or weekly charts.
Final Takeaways
Mastering how to read candlesticks isn’t just a technical skill — it’s your advantage in any market. On Pocket Option, you can apply it instantly, whether you’re trading forex, crypto, or stocks — with flexible timeframes, 100+ assets, and tools like AI Trading, Social Trading, and even tournaments to test your skills.
Start tradingAbout the author :
Learning
Sign up for more like this
Customize your newsfeed with content you're actually interested in — get up-to-date personalized newsletter in your inbox.
Your comment
Comments are pre-moderated to ensure they comply with our blog guidelines.