- Reveal institutional activity behind false breakouts
- Offer zones with high probability of price reaction
- Help filter out unreliable signals in ranging markets
Breaker Block Trading

Updated on 14 Jul 2025
The financial markets present numerous opportunities for traders seeking to enhance their analytical skills. Understanding advanced trading concepts can significantly impact trading outcomes. This article explores the mechanics and implementation of breaker block trading, a powerful approach to market analysis and trade execution.
Article navigation
- Breaker Block Trading: Understanding the Pattern Behind Market Reversals
- What Is a Breaker Block in Trading?
- Why Breaker Blocks Matter
- Breaker Block Structure
- Core Elements of a Breaker Block
- Timeframes for Application
- How to Use Breaker Block Trading in Practice
- Trading Plan Framework
- Mistakes to Avoid
- Breaker Block Trading on Pocket Option
- Recent Insights and Practical Tips
- Conclusion
Breaker Block Trading: Understanding the Pattern Behind Market Reversals
Price movements in financial markets aren’t always random. Often, they’re shaped by large players who manipulate key levels to trigger false breakouts and collect liquidity. Breaker block trading helps traders spot these manipulated zones and use them to improve entry and exit precision.
In this article, you’ll learn what is a breaker block in trading, how to identify it, and how to apply it in real market scenarios.
What Is a Breaker Block in Trading?
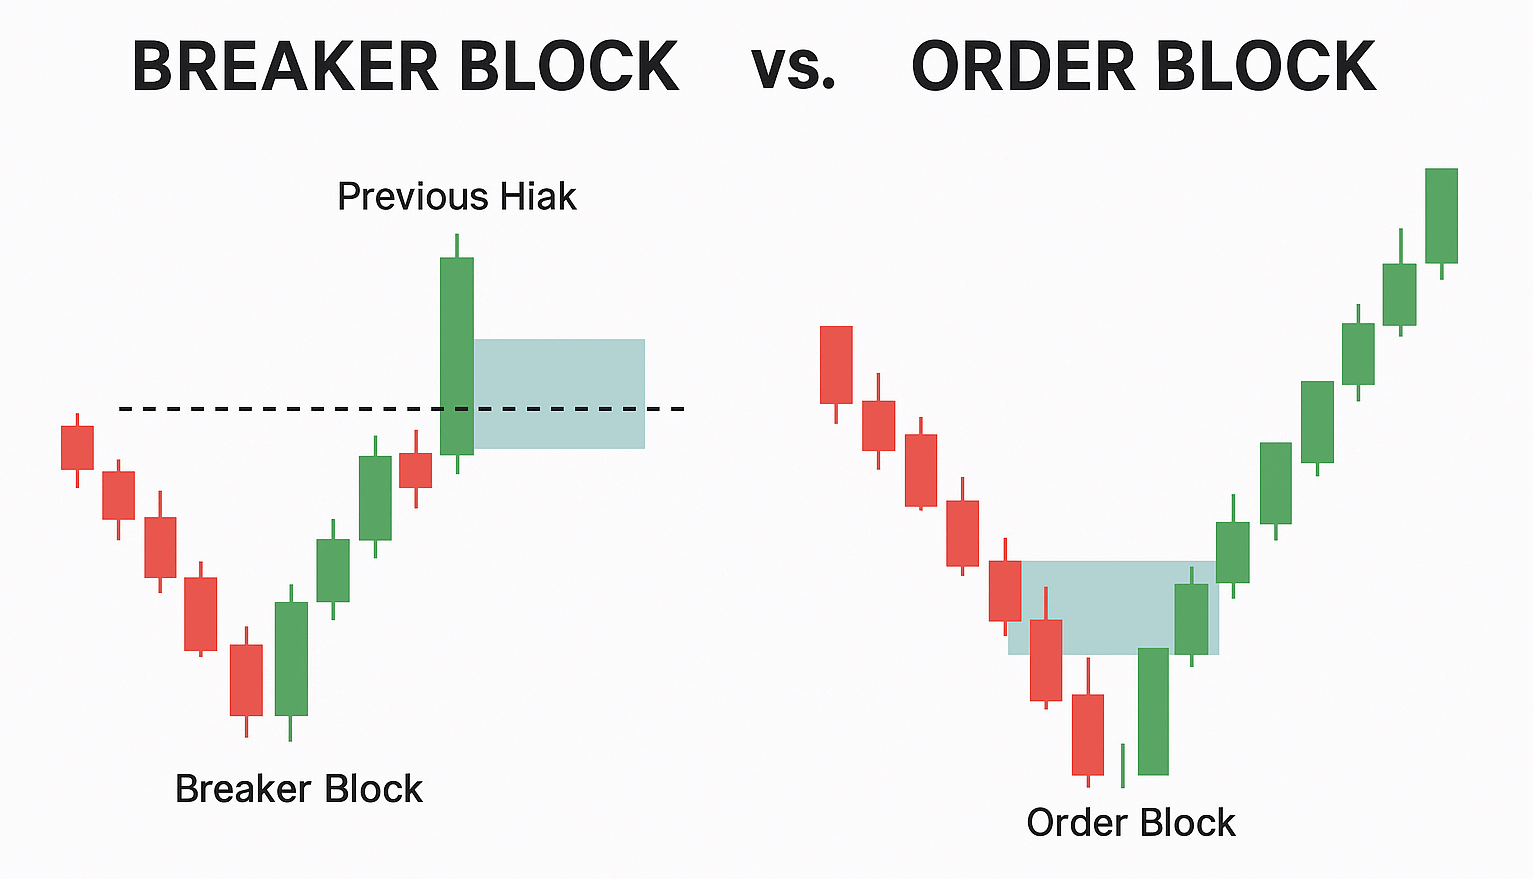
A breaker block is a price zone that forms just before a false breakout. The market creates a strong move, breaks a key level, then quickly reverses. The candles before this failed breakout become the breaker block.
Traders watch these zones because they often reveal where institutions entered the market. When price revisits a breaker block, it frequently reacts — making these areas ideal for trade setups.
Why Breaker Blocks Matter
Breaker blocks serve as important reference points because they:
This concept is widely used in smart money trading strategies.
Breaker Block Structure
To spot a breaker block, look for the following pattern:
- A strong directional move toward a support or resistance level
- A brief breakout beyond that level, quickly followed by reversal
- The last candles before the breakout form the breaker block
- Price returns to this zone later and often rejects it
This setup helps traders avoid chasing price and instead trade with structure.
Core Elements of a Breaker Block
| Component | Description | Significance |
|---|---|---|
| Initial Move | Strong push in one direction | Shows institutional intent |
| Pullback | Short retracement | Builds tension before the breakout |
| Breakout | False move beyond key level | Confirms market manipulation |
Timeframes for Application
Breaker blocks can be found on any chart, but their strength depends on the timeframe.
| Time Frame | Characteristic | Usage |
|---|---|---|
| Monthly / Weekly | Strongest zones | Strategic long-term levels |
| Daily / 4H | Medium strength zones | Swing trade setups |
| 1H / 15M | Precise zones | Day trading entries and exits |
Higher timeframes help define major zones, while lower ones allow for refined execution.
How to Use Breaker Block Trading in Practice
Here’s a step-by-step approach to trading breaker blocks:
- Identify a sharp move toward a key level followed by a false breakout
- Mark the last bullish or bearish candles before the breakout
- Wait for the price to return to that zone
- Look for rejection or confirmation (e.g., volume spike, engulfing candle)
- Enter the trade and place your stop just beyond the breaker block
- Set take profit at the next significant level
This process adds structure and clarity to your trades.
Trading Plan Framework
| Element | Purpose | How to Apply |
|---|---|---|
| Entry | Trade trigger | Confirm reaction at breaker zone |
| Stop Loss | Manage risk | Outside the breaker block zone |
| Take Profit | Lock in gains | Target next support/resistance level |
Always ensure a solid risk-to-reward ratio, ideally 2:1 or better.
Mistakes to Avoid
- Trading every breaker block without confirmation
- Confusing ordinary pullbacks with false breakouts
- Ignoring context from higher timeframes
- Overcomplicating entries with too many indicators
Focus on clean price structure, volume, and candle behavior near the breaker block zone.
Breaker Block Trading on Pocket Option
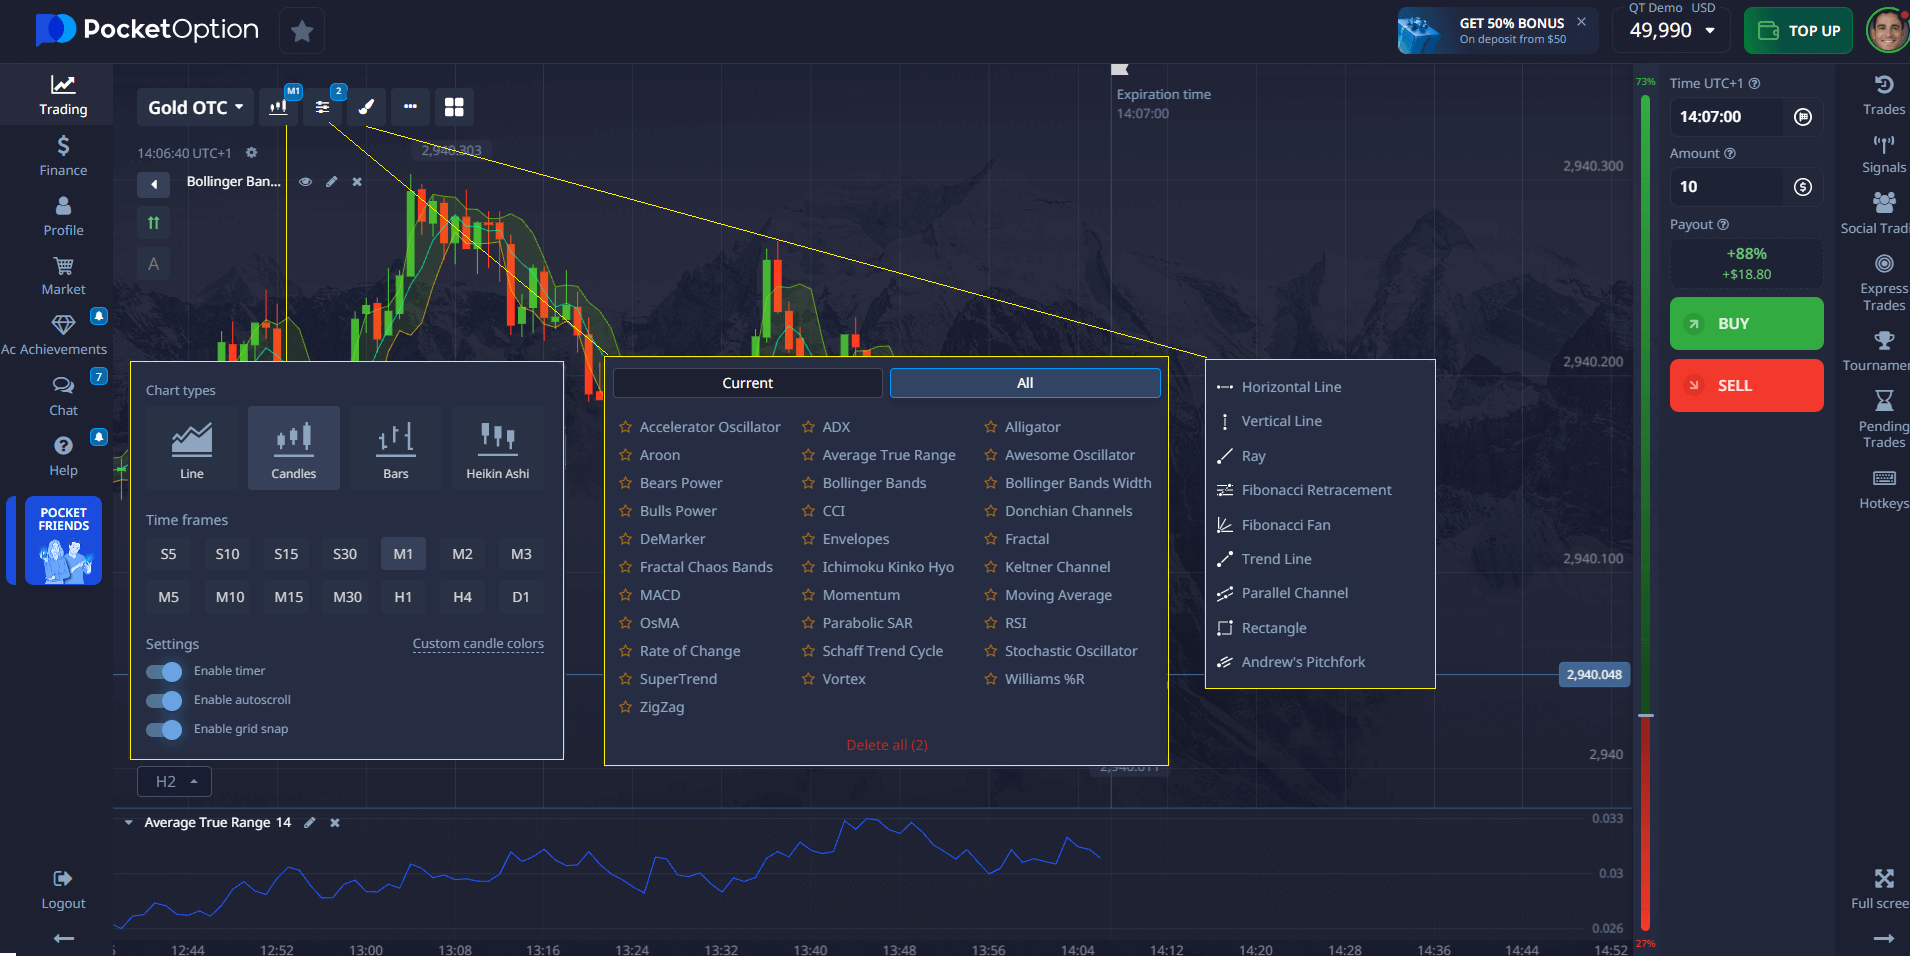
Pocket Option provides the perfect tools to bring breaker block trading to life:
- 4 chart types (Line, Area, Candlestick, Heiken Ashi)
- Dozens of indicators and graphic tools for detailed analysis
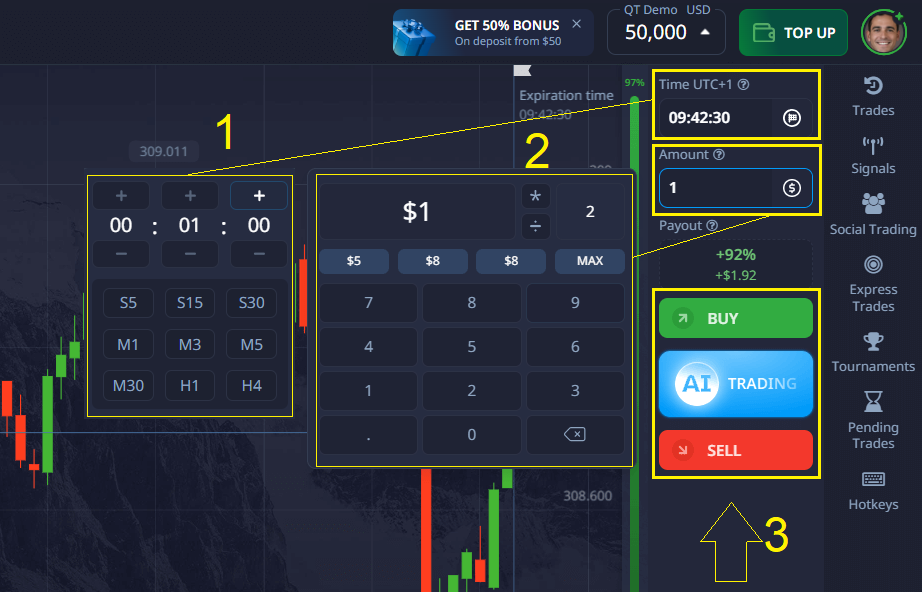
- Ability to place trades from 5 seconds up to 4 hours, including OTC assets
- Real-time access to multi-timeframe views for advanced strategies
📊 Explore Pocket Option’s Chart Tools Today
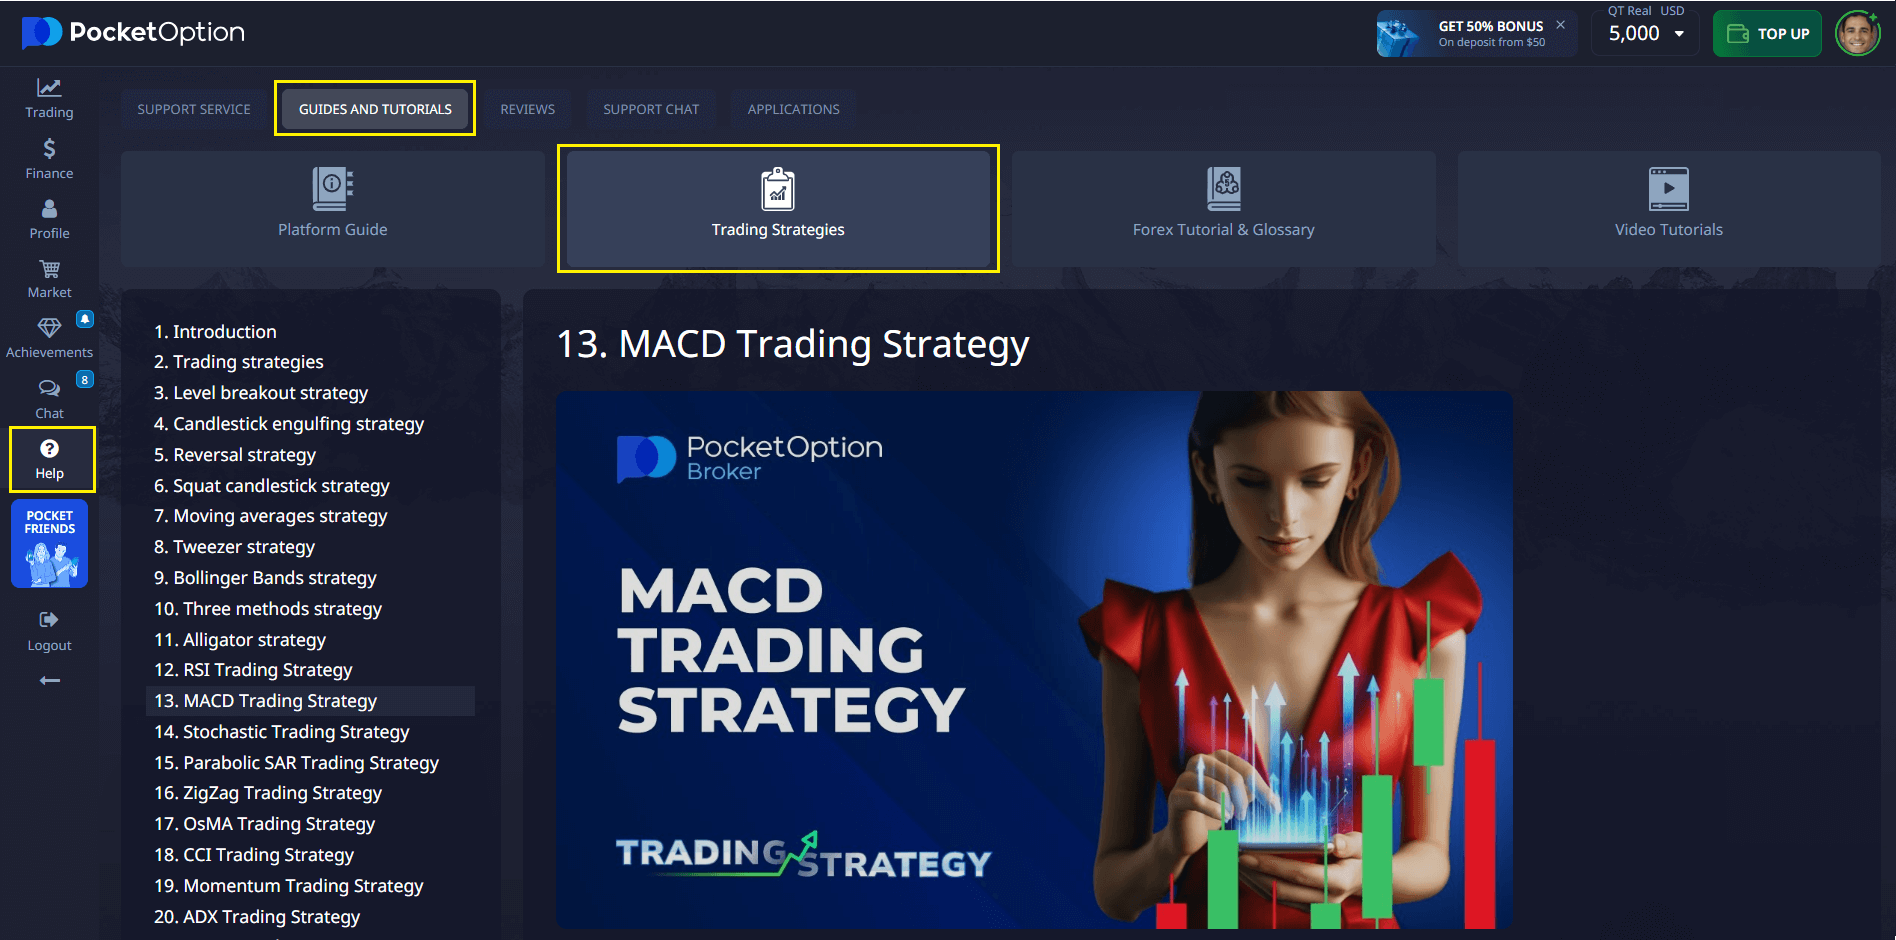
Need help getting started? Head to Help → Guides and Tutorials on the platform. There you’ll find simple training materials on trading strategies, market structures, indicators, and more.
Even better, you can test your breaker block strategy risk-free on a $50,000 demo account. It’s an excellent way to build confidence and gain experience before trading live.
Recent Insights and Practical Tips
- Breaker blocks often appear after liquidity grabs or stop hunts
- They become more powerful when aligned with supply and demand zones
- Smart traders use confluence with indicators like RSI divergence or volume spikes
- Pocket Option makes it easy to test setups using all available tools and timeframes
Conclusion
Breaker block trading is a highly effective way to follow smart money movements and trade with precision. By understanding what is a breaker block in trading, and combining that knowledge with the analytical tools on Pocket Option, you can approach the markets with more structure, less emotion, and greater potential.
With a full-featured demo account, real-time charts, and built-in education, Pocket Option gives you everything needed to trade like a pro — even if you’re just getting started.
FAQ
How does breaker block trading differ from traditional support and resistance?
Breaker block trading focuses on specific price structures and momentum shifts, while traditional support and resistance primarily deal with static price levels. Breaker blocks incorporate multiple price components and require confirmation through specific pattern completion.
What are the optimal time frames for identifying breaker blocks?
The most effective time frames are the 4-hour and daily charts for pattern identification, with lower time frames used for entry precision. Higher time frames provide strategic overview, while lower time frames help with tactical execution.
Can breaker block trading be combined with other technical analysis tools?
Yes, breaker block trading can be effectively combined with volume analysis, trend indicators, and momentum studies. This integration enhances pattern validation and improves trading decisions.
What risk management principles should be applied when trading breaker blocks?
Key risk management principles include position sizing based on account size, setting stop losses below or above the breaker block structure, and maintaining a consistent risk-to-reward ratio for each trade.
How can traders validate breaker block patterns effectively?
Pattern validation involves confirming price momentum, checking volume profiles, ensuring proper market structure, and waiting for complete pattern formation before entry.
Learning
Sign up for more like this
Customize your newsfeed with content you're actually interested in — get up-to-date personalized newsletter in your inbox.
Your comment
Comments are pre-moderated to ensure they comply with our blog guidelines.