- Identify previous price turning points: Look for areas on the chart where price previously reversed or consolidated. These zones are likely to act as future support (in downtrends) or resistance (in uptrends).
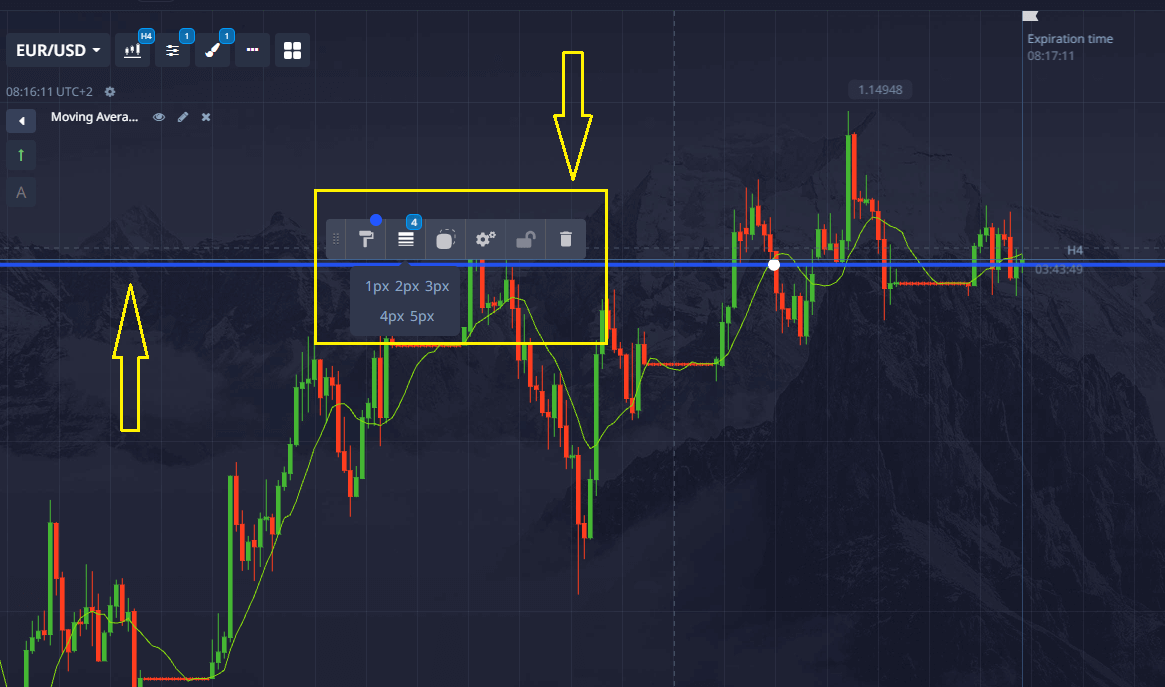
- Use horizontal line tools: Once you spot these key price levels, apply the horizontal line tool from the chart’s drawing panel. Mark lines at significant price clusters to visually indicate support and resistance zones.
- Analyze across timeframes: To improve reliability, check these levels across multiple timeframes. Levels that appear on both short- and long-term charts are typically stronger.
- Combine with technical indicators: To refine analysis, use additional indicators such as pivot points, moving averages, or oscillators. This helps validate the signals and confirms whether a support or resistance level is still active.
- Observe price behavior: Watch how price reacts around these levels. If the price consistently rebounds from a marked level, it strengthens that level’s status. Conversely, a breakout might signal a trend shift or acceleration.
Pocket Option Support And Resistance Strategy

Updated on 18 Jul 2025
Navigating the volatile world of trading requires reliable methods that stand the test of time. The Pocket Option support and resistance strategy represents one of the most fundamental yet powerful approaches to reading market behavior, providing traders with crucial decision points and high-probability trading opportunities across multiple timeframes. This trading strategy is especially useful for those looking to optimize their decisions when trading binary options (Pocket Option Quick Trading) using support or resistance levels under fast-changing market conditions.
Article navigation
- Understanding Pocket Option support and resistance strategy
- Mastering the Fundamentals of Pocket Option Support and Resistance
- Identifying High-Probability Support and Resistance Zones
- Five Practical Applications of the Pocket Option Support And Resistance Strategy
- The Psychology Behind Support and Resistance Success
- Essential Risk Management Parameters
- Combining Support and Resistance with Complementary Indicators
- Implementing Your Pocket Option Support And Resistance Strategy
Understanding Pocket Option support and resistance strategy
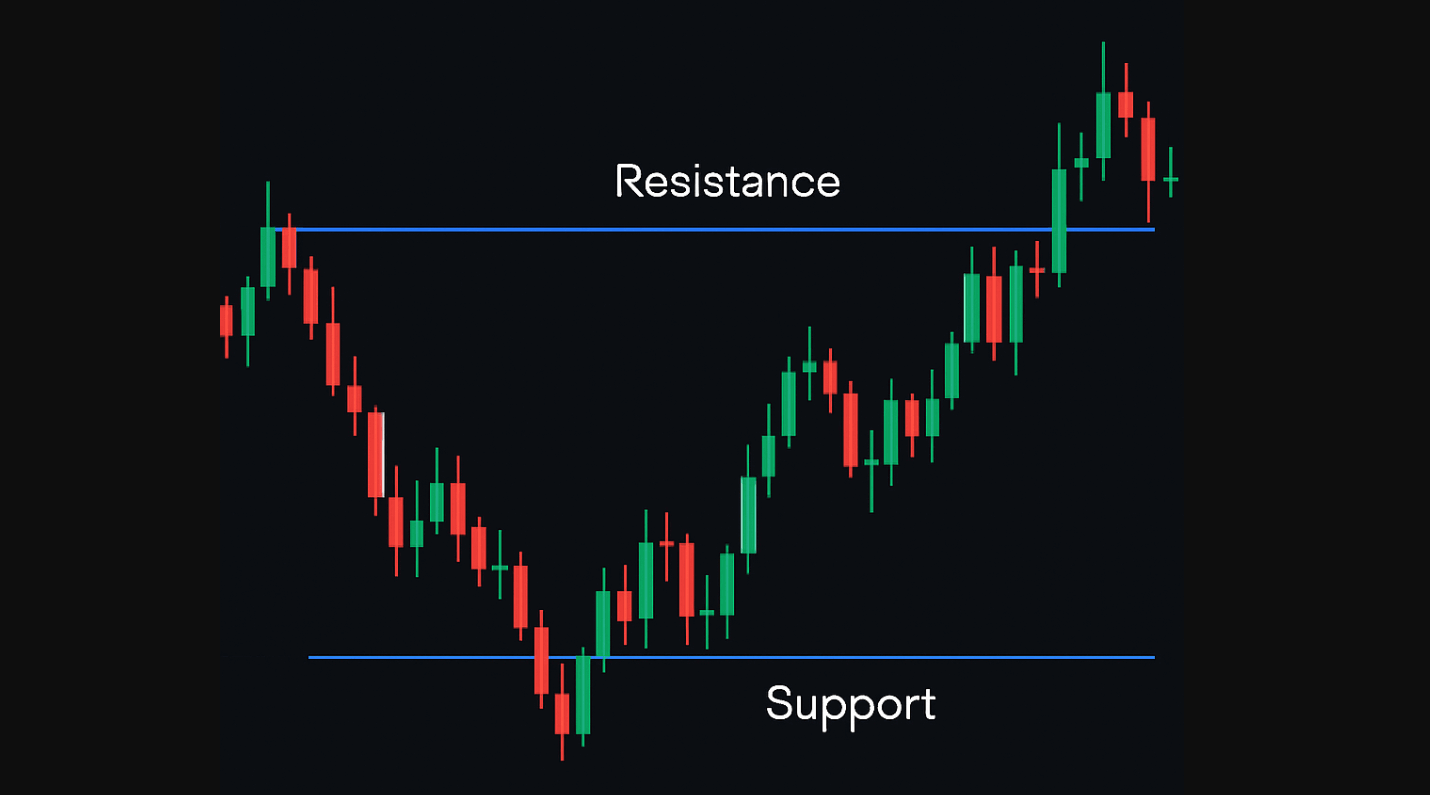
📌 At Pocket Option, support and resistance are essential technical analysis tools that help traders identify potential price reversal zones. A support level is where a downtrend might pause due to increased buying interest, whereas a resistance level is where an uptrend could slow or reverse because of selling pressure. These tools help traders respond quickly to key support or resistance level changes.
🎙️ “Support and resistance aren’t just lines on a chart; they’re a reflection of mass psychology and institutional memory. When used with discipline, they can outperform many complex models.” — Lars König, Market Structure Analyst at FX Metrics Lab
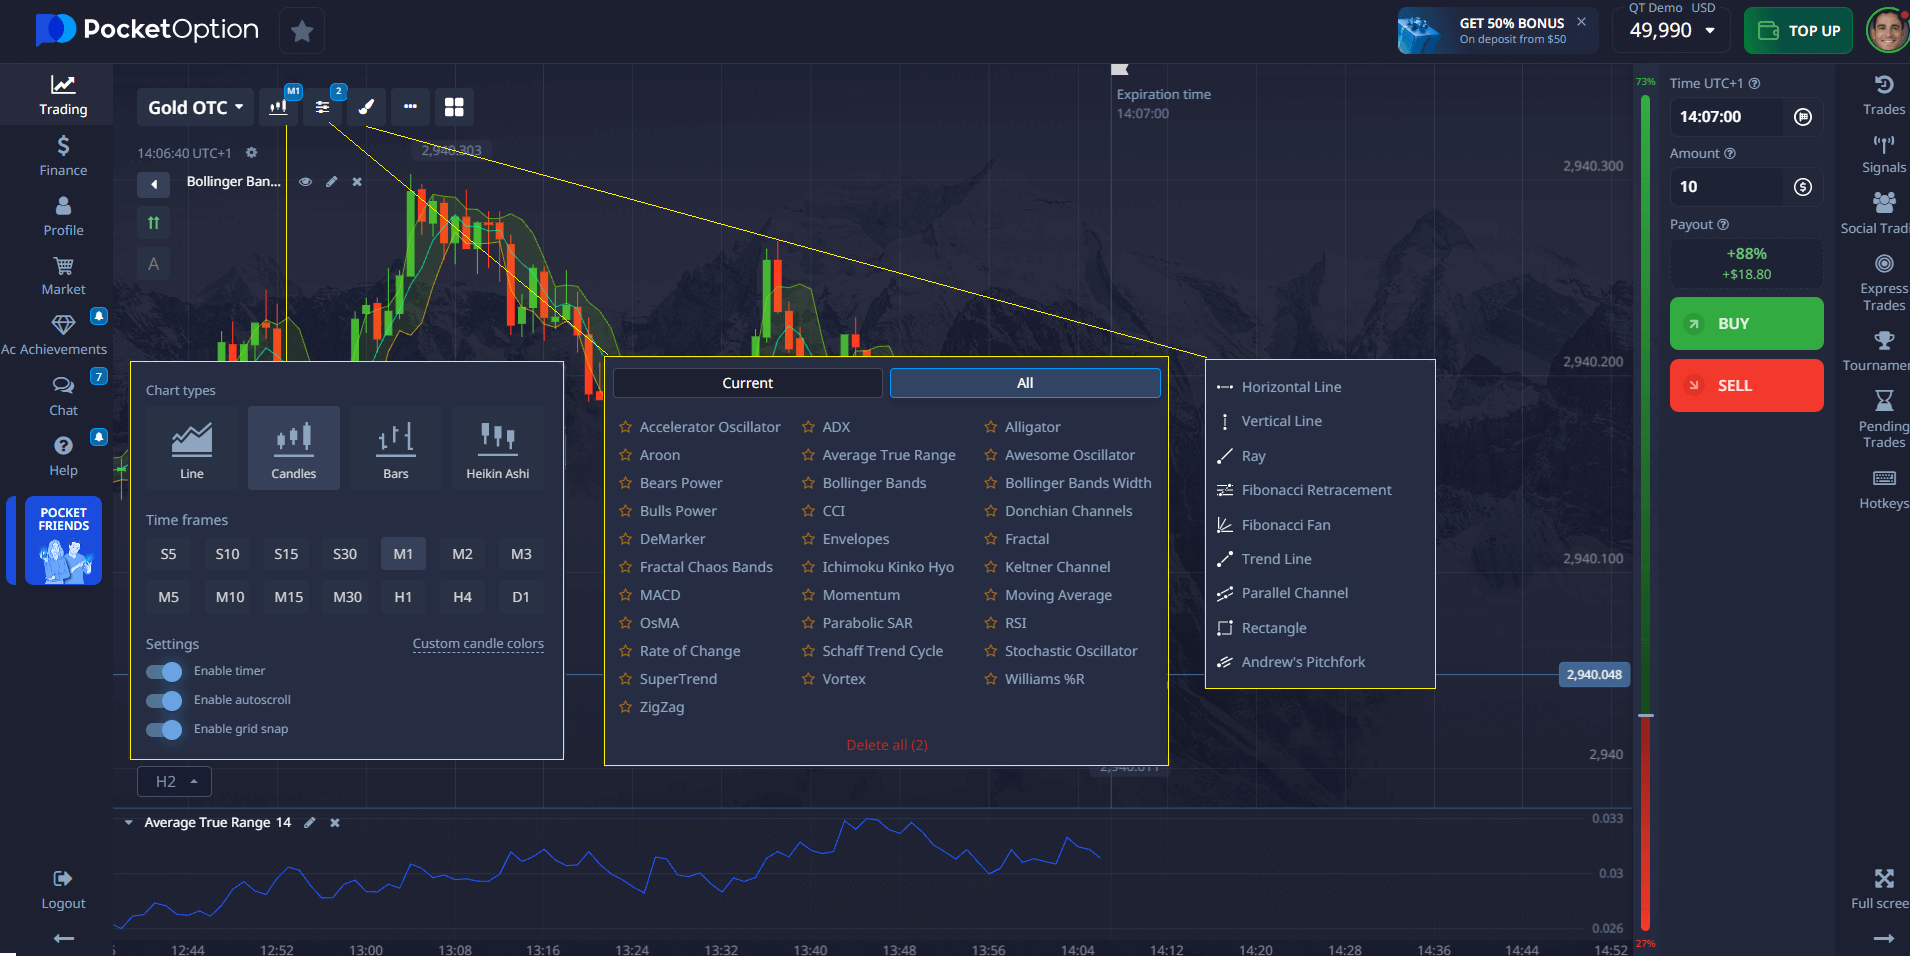
Pocket Option’s advanced charting system includes tools that allow you to draw horizontal lines, analyze multiple timeframes, and incorporate technical indicators such as the moving average to verify these levels in real-time market conditions. Traders can access all of this directly from the web interface without installing external software, making it especially effective for quick trading decisions on the Pocket Option trading platform.
Mastering the Fundamentals of Pocket Option Support and Resistance
The Pocket Option support resistance strategy forms the cornerstone of profitable technical analysis across all markets. These critical price levels create invisible barriers where buying and selling pressure clash, generating predictable trading opportunities. Support emerges when buyers overpower sellers, preventing further price decline, while resistance forms when sellers dominate buyers, establishing price ceilings that halt advances. These support and resistance levels are crucial to formulating high-probability trading techniques.
Unlike complex indicators that lag or produce false signals in volatile conditions, support and resistance levels on Pocket Option reveal real-time market psychology. This approach works consistently across all instruments—currencies, commodities, and stocks—regardless of market conditions or timeframe. Traders can use these insights to craft reliable trading decisions.
Practical Example: Drawing a Support Level on Pocket Option
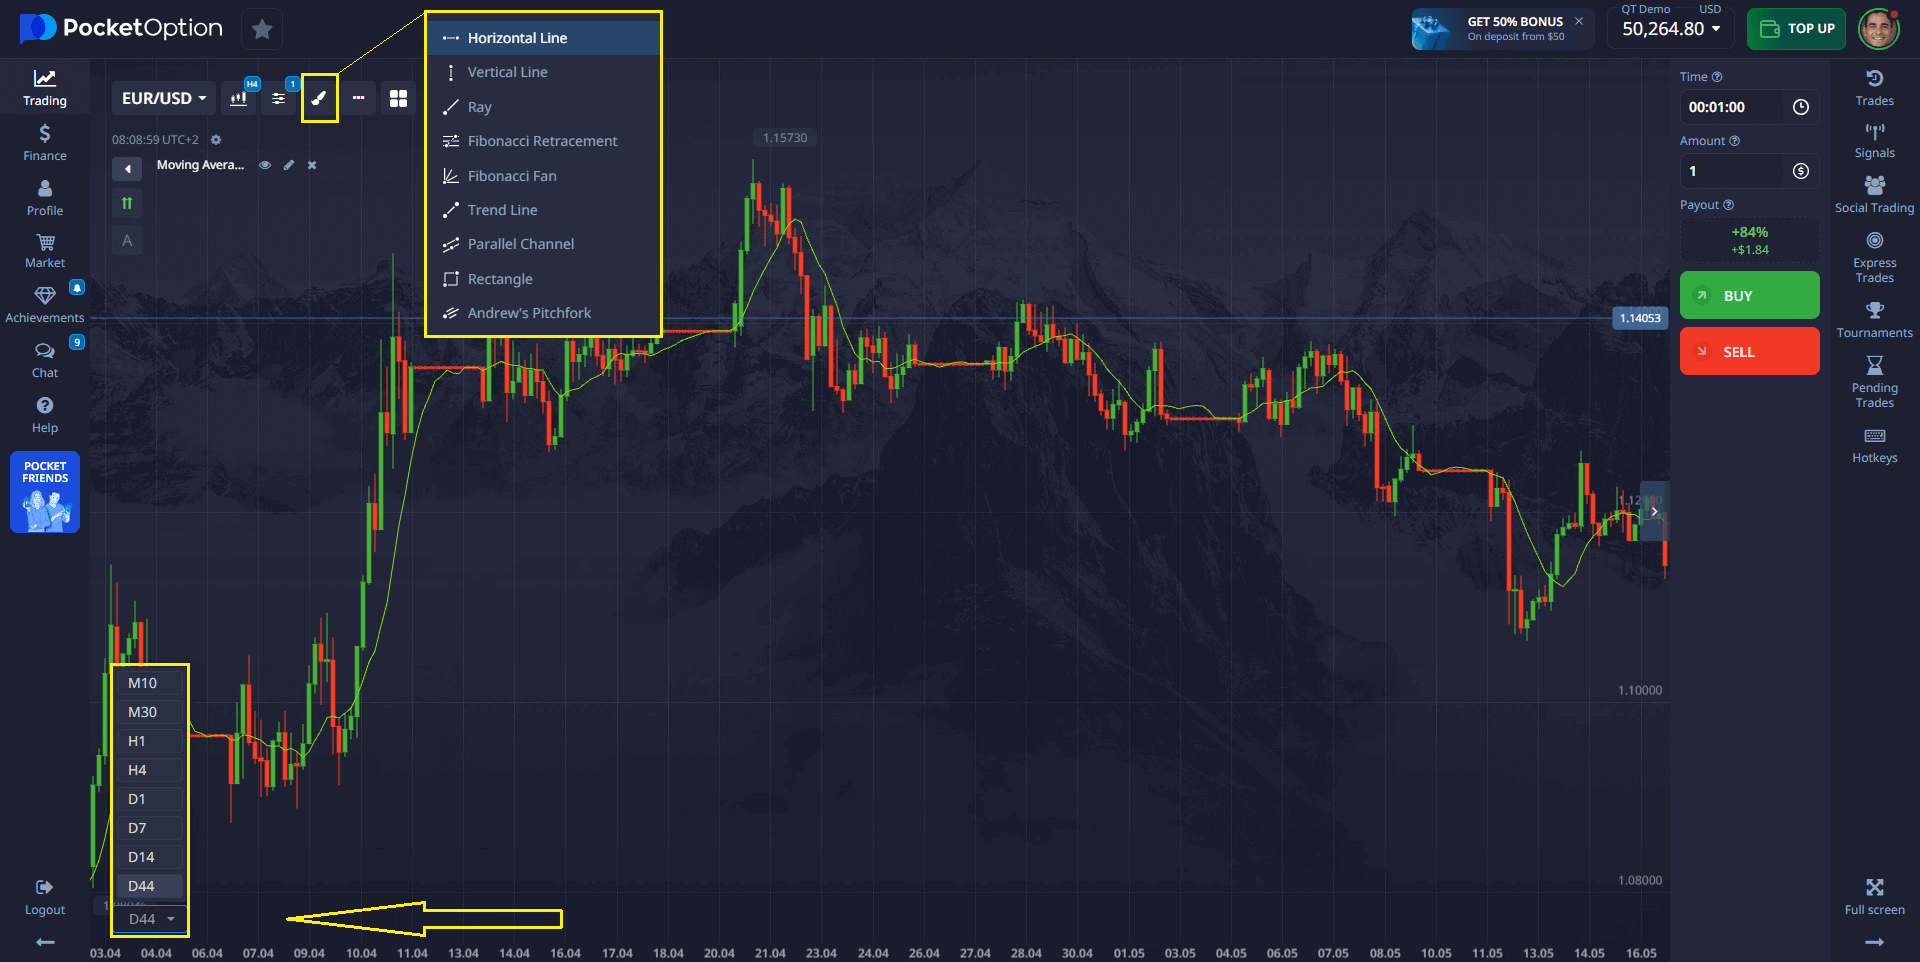
- Open any Pocket Option chart — for example, EUR/USD.
- Scan recent price history and visually identify areas where the price dropped and bounced up more than once.
- These zones usually resemble a “floor” where downward movement pauses.
- Spot two or more price bounces at nearly the same level.
- Use the horizontal line tool to mark that level on your chart.
- That becomes your first support level.
- Watch how the price behaves next time it approaches that level.
Identifying High-Probability Support and Resistance Zones
Successful implementation of the Pocket Option support and resistance strategy requires precise identification techniques. Analyze at least 3–6 months of price history to identify recurring turning points where price has reversed multiple times. The strength of these levels directly correlates with three key factors: frequency of touches, volume during reversals, and recency of formations. This analysis is at the heart of effective trading strategies.
📊 “The most overlooked tip is to always zoom out. What looks significant on a 5-minute chart might be irrelevant on the daily.” — Sofia Almeida, Technical Trading Instructor, FinScope Global
| Level Strength | Characteristics | Trading Action |
|---|---|---|
| Weak | 1–2 touches, low volume, outdated level | Use only as a reference; avoid direct trades |
| Moderate | 3–4 touches, average volume, recent reactions | Combine with confirmation tools like RSI or candlestick patterns |
| Strong | 5+ touches, high volume, clear bounces | Use as a core setup for directional Quick Trades |
Psychological round numbers like 1.0000, 100.00, or 25000 often act as magnet zones for price behavior. On Pocket Option, these function as strong support and resistance levels. Experienced traders typically forecast price reactions slightly above or below these levels (e.g. 10–15 pips offset) to avoid areas with concentrated retail activity and false breakouts—commonly known as stop hunts in traditional markets.
Five Practical Applications of the Pocket Option Support And Resistance Strategy
- Bounce Trading (70–80% Win Rate): The highest-probability application involves trading bounces off established levels, particularly effective in ranging markets. Enter long positions when price approaches support with confirmation from bullish candlestick patterns (engulfing, hammer) or oversold RSI readings (below 30).
💬 “I mainly trade bounces at psychological zones. Pocket Option’s chart tools let me mark them in seconds.” — Miguel Ochoa, Pocket Option trader
- Breakout and Retest Trading (65–75% Win Rate): When price breaks through established levels, the role-reversal principle creates high-probability setups. Former support converts to resistance after downside breakouts, while former resistance becomes support after upside breakouts. Enter trades only after price conclusively closes beyond the level (minimum 1% penetration) and returns to test the broken barrier. This is a classic example of breakout trading in action.
- Advanced Pattern Recognition: Elevate your Pocket Option support and resistance strategy by identifying these high-probability complex patterns:
- Double tops/bottoms: Two peaks/troughs at similar levels indicating reversal (75% success with volume confirmation)
- Head and shoulders: Three peaks with middle peak higher, suggesting trend reversal (70% success with neckline break)
- Ascending/descending triangles: Price consolidation between support/resistance and trendline (67% success in breakout direction)
- Multi-Timeframe Confluence Trading: The most powerful support and resistance levels appear across multiple timeframes. On Pocket Option, identify levels that align on daily, 4-hour, and 1-hour charts before entering positions. These multi-timeframe confluence zones increase success rates by 15–20% compared to single-timeframe approaches.
- Range-Bound Market Strategies: When markets consolidate between clear support and resistance levels, implement range-trading strategies. Enter longs at support with targets at mid-range (50%) and upper resistance (100%). Similarly, enter shorts at resistance with targets at mid-range and lower support.
The Psychology Behind Support and Resistance Success
The Pocket Option support and resistance strategy works because these levels represent collective memory points where market participants made significant decisions. As price approaches these levels again, three psychological factors drive predictable behavior:
- Missed opportunity traders who wait for price to return
- Trapped traders seeking breakeven exits
- Pattern-recognition traders exploiting setups repeatedly
📈 “Once you start seeing support and resistance as zones of human emotion, your chart transforms into a story.” — Mei Nakamura, Sentiment-Based Trader
Essential Risk Management Parameters
Risk management remains essential, regardless of how precise your levels are. Avoid overleveraging, and always assess risk-reward before entering a trade.
Combining Support and Resistance with Complementary Indicators
Pairing these levels with moving averages and volume analysis increases clarity. Divergences, candle confirmations, and momentum changes should all support your thesis before you act.
Implementing Your Pocket Option Support And Resistance Strategy
The support and resistance strategy offers one of the most reliable approaches to consistent trading profits. Follow a structured plan: start with bounces, then breakouts, and add confluence zones and patterns as your skill grows.
💬 “It took me a month to get it right, but once I did, my win rate jumped 20%. All thanks to structured support/resistance analysis on Pocket Option.” — Rami Jaber, retail trader
This strategy works not because it’s flashy—but because it aligns with how all traders, from retail to institutional, view the market. Begin with a few key pairs, use Pocket Option’s free built-in tools, and focus on high-probability setups backed by logic—not emotion. Discuss this and other insights in our community!
FAQ
What makes support and resistance levels so important in trading?
Support and resistance levels represent psychological price barriers where buying and selling pressure typically intensify. These areas create natural decision points where market participants consistently react, making them valuable for predicting potential price reversals or breakouts.
How can I identify the strongest support and resistance levels on Pocket Option?
Look for price levels that have been tested multiple times with clear rejections and high trading volume. The most significant levels typically show sharp reversals, appear on multiple timeframes, and often coincide with other technical indicators like round numbers or Fibonacci levels.
Should I enter trades exactly at support and resistance levels?
Waiting for confirmation signals rather than entering trades exactly at levels is generally safer. Look for candlestick patterns, volume increase, or indicator signals that confirm the level is holding before entering, as this reduces the risk of false breakouts.
How do I handle breakouts through support and resistance?
When breakouts occur, wait for a retest of the broken level to confirm the role reversal principle. Former support should now act as resistance (and vice versa), providing a safer entry point with a tighter stop loss placement.
Can the Pocket Option support and resistance strategy work with all trading styles?
Yes, support and resistance principles apply across all timeframes and trading styles. Scalpers may use minor support/resistance levels on smaller timeframes, while swing traders focus on major levels on daily or weekly charts, but the core principles remain consistent.
Which strategy is best for Pocket Option trading?
The best strategy for Pocket Option trading depends on your style, but support and resistance trading stands out due to its simplicity and effectiveness in fast-paced Quick Trading. It allows traders to identify high-probability reversal zones and forecast short-term price moves without relying on lagging indicators. Many experienced traders also combine this with candlestick patterns or RSI for added confirmation.
Is support and resistance the best trading strategy?
Yes, for many traders—especially in binary options—support and resistance is considered one of the most reliable trading strategies. It’s grounded in price action and market psychology, making it adaptive across all timeframes and assets. On Pocket Option, this strategy is particularly effective when used with multi-timeframe analysis and tools like horizontal lines, moving averages, and volume spikes.
How to win tournament in Pocket Option?
To win a tournament on Pocket Option: Focus on high-probability setups like bounces or breakouts from strong support/resistance zones. Use short expiration times with tight confirmation signals (e.g. RSI, candlestick patterns). Manage your volume wisely—don't go all-in too early. Consistency often beats aggression. Take advantage of multi-timeframe confluence and avoid trading during news releases or high volatility spikes.
Trading Strategies
Sign up for more like this
Customize your newsfeed with content you're actually interested in — get up-to-date personalized newsletter in your inbox.
Your comment
Comments are pre-moderated to ensure they comply with our blog guidelines.