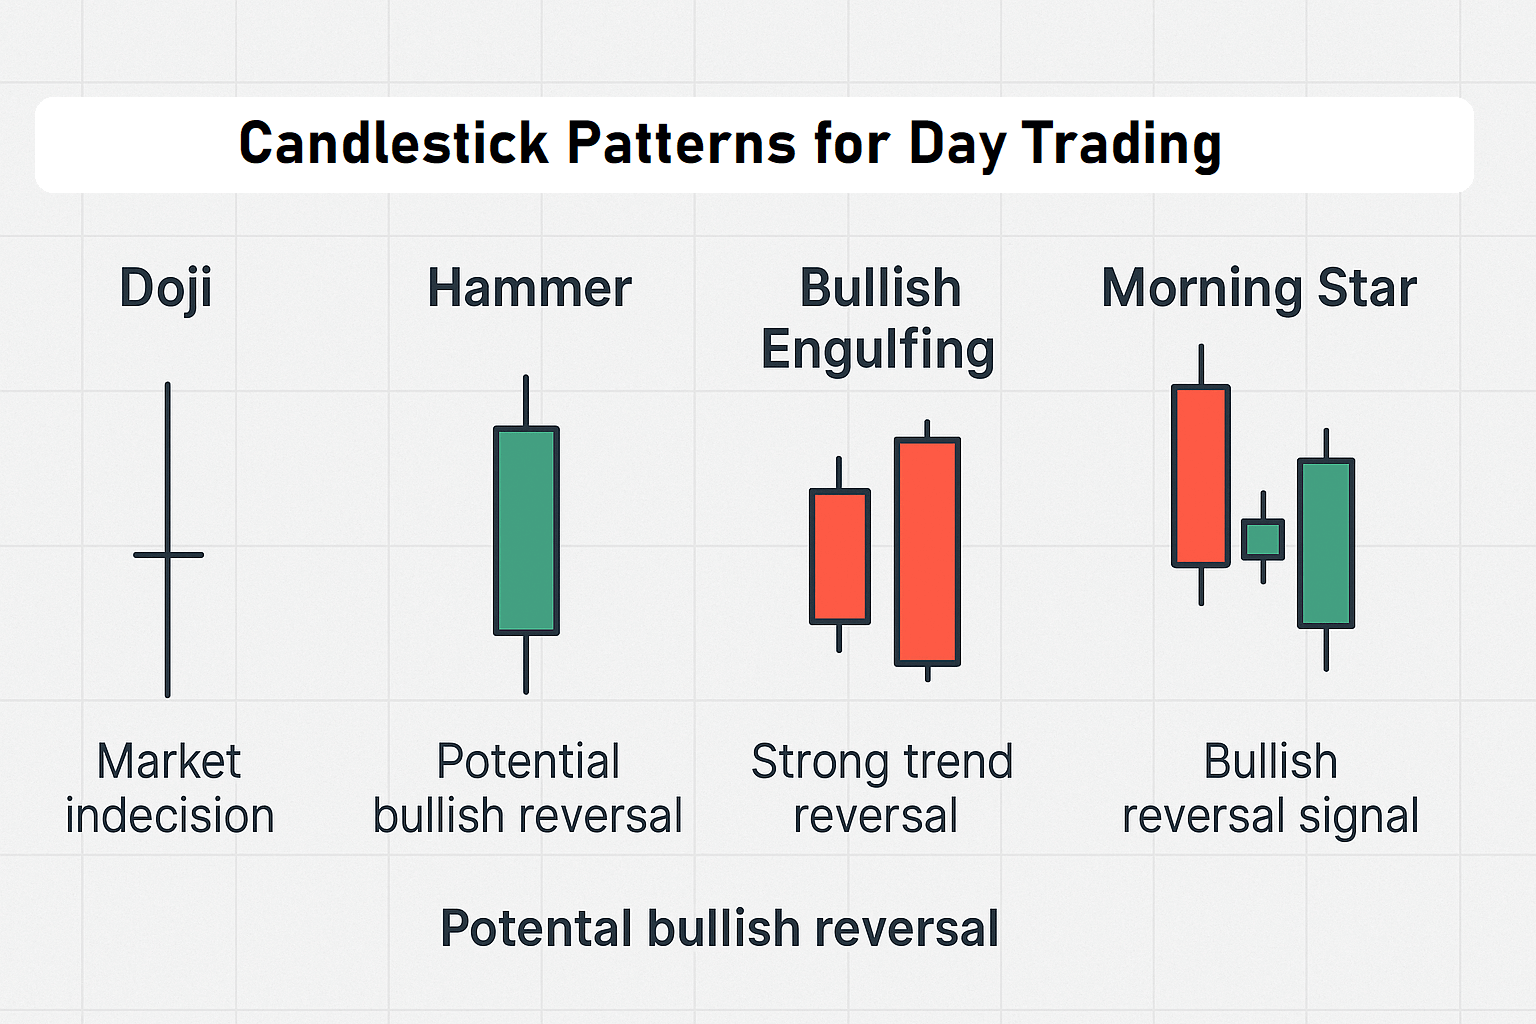
- A doji with equal open/close suggests indecision.
- A hammer shows rejection of lower prices.
- A bullish engulfing signals a strong reversal.
- A dark cloud cover warns of incoming bearish pressure.
Mastering Best Candlestick Patterns for Day Trading

5 min to read
Updated on 03 Sep 2025
The world of day trading requires precise analytical skills and deep market understanding. Learning to interpret price movements through candlestick patterns enables traders to make data-driven decisions. This comprehensive analysis explores the most effective approaches to candlestick pattern trading.
Mastering Best Candlestick Patterns for Day Trading
The best candlestick patterns day trading experts use are not just visual tools—they represent real market psychology. Recognizing and interpreting day trading patterns like doji formations, hammer patterns, engulfing structures, and morning star configurations allows traders to make timely, confident decisions based on price action patterns and proven setups. These patterns are essential components of technical analysis patterns, offering insights that can lead to more profitable trades when used with discipline and strategy.
“Learning candlestick formations is one of the fastest ways to develop intuitive chart-reading skills. Once internalized, these patterns offer an edge in fast markets.” — Gregory L. Morris, author of Candlestick Charting Explained
How Candlestick Pattern Trading Works in Day Trading
Each candlestick delivers critical trading data: open, close, high, and low. These components form recognizable shapes that reflect trader sentiment, momentum, and potential reversals. A strong green body, for example, often indicates bullish conviction, while a long lower wick may suggest rejection of lower prices. In candlestick pattern trading, these signals form the core of real-time decision-making, especially when backed by context.
| Candlestick Element | Price Information | Market Indication |
|---|---|---|
| Body | Open and Close prices | Direction of the move |
| Upper Shadow | High price | Buying pressure resistance |
| Lower Shadow | Low price | Selling pressure rejection |
How to Read Candlestick Patterns
Understanding candlesticks involves analyzing the relationship between their components and how they interact within trends:
Reading these in context—alongside volume, support/resistance, or market structure—can dramatically increase a trader’s precision and reduce false signals.
Top Candlestick Patterns with High Success Rates
Here are the most effective technical analysis patterns used by traders for both reversals and continuation signals:
| Pattern Type | Description | Accuracy Rate |
|---|---|---|
| Doji formations | Open and close nearly equal — signals indecision | 65% |
| Hammer patterns | Long lower wick — potential bullish reversal after downtrend | 70% |
| Engulfing structures | One candle completely overtakes previous body — strong trend reversal | 75% |
| Morning star configurations | Three-candle setup signaling bullish reversal post-downtrend | ≈ 68% |
| Dark cloud cover | Bearish candle closes below mid-point of prior bullish candle | 64% |
| Spinning top | Small body with long shadows — indecision or trend pause | 60% |
| Hanging man | Appears after uptrend — warns of potential top | 67% |
🚀 Ready to spot these patterns in action?
Create your Pocket Option account today!
Continuation vs Reversal Patterns
Understanding the type of pattern is essential:
- Reversal Patterns: Signal potential change in trend (e.g., hammer, morning star, bearish engulfing).
- Continuation Patterns: Indicate trend is likely to continue after a pause (e.g., doji, spinning top).
Integrating this distinction into your strategy helps avoid entering too early or exiting too late.
Using Market Context to Validate Patterns
| Market Environment | Pattern Performance | Action Strategy |
|---|---|---|
| High Volume Zones | Enhanced | Act immediately with confidence |
| Consolidation Phase | Neutral | Wait for confirmation |
| Volatile Sessions | Varies | Reduce position size |
Pro Tip: Validate every candlestick pattern trading setup with support/resistance levels or indicators like RSI and volume. This dramatically increases their effectiveness.
Pattern Recognition Tools in Day Trading
Why Use Pattern Recognition Software?
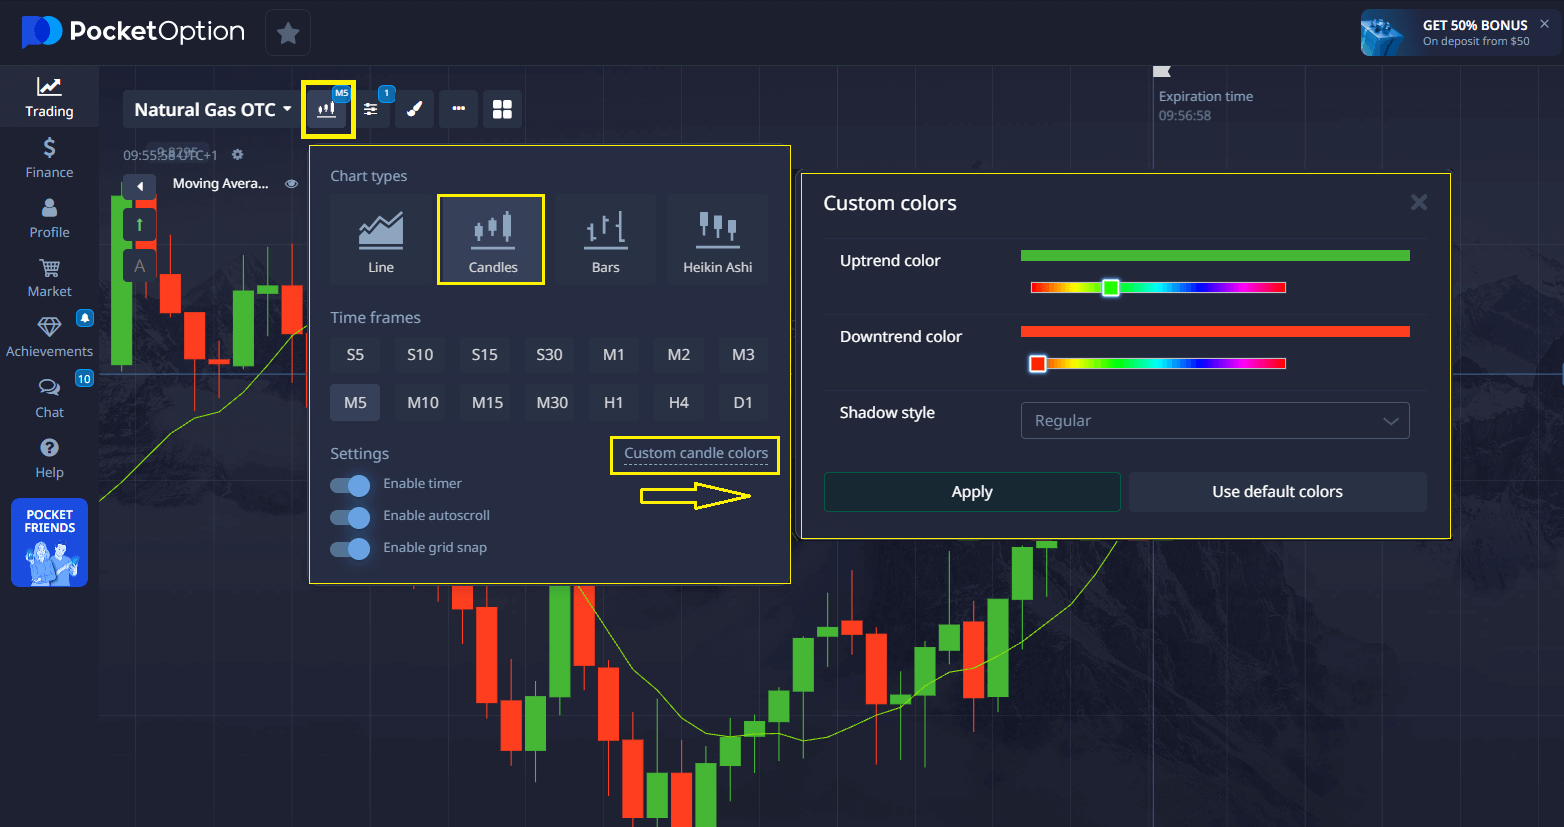
Modern traders use advanced tools to identify price action patterns in real time. These tools analyze charts and automatically detect:
- bullish engulfing
- doji formations
- hammer patterns
- morning star configurations
Benefits for Pocket Option Traders
- Real-time alerts for entry opportunities
- Eliminate emotional bias
- Save time analyzing charts
- Boost consistency in execution
Choosing the Right Tool
Look for:
- Visual pattern overlays
- Multi-timeframe support
- Integration with Pocket Option or trading platforms
- Customizable alerts
📊 Don’t want to miss a winning setup?
Use Pocket Option’s real-time charts and recognition tools!
Case Study: Using Hammer Pattern on USD/JPY
Trader Liam noticed a hammer candlestick on the 5-minute USD/JPY chart during a volatile Tokyo session. Backed by increased volume and support level, he entered a long position and captured a 2.4% intraday gain.
“The hammer pattern helped me confirm my bias. Pocket Option’s clean charting and fast execution made the entry seamless.” — Liam
Real Trader Feedback
- “Doji formations on the 15-minute chart warned me of exhaustion. It saved me from a premature breakout entry.” — Sophia
- “Morning star configurations on EUR/USD have become my go-to signal. Once I see confirmation, it’s almost automatic.” — Carlos
These insights highlight how real users incorporate candlestick pattern trading into their workflow with confidence.
Statistics: Success Rates and Backtesting
| Pattern | Success Rate (based on 1000+ tests) |
|---|---|
| Bullish Engulfing | 66–69% |
| Hammer | 70–72% |
| Morning Star | 67–69% |
| Hanging Man | 64–66% |
Source: backtested on Pocket Option simulator using 5M and 15M timeframes, 2024–2025
“Backtesting candlestick setups over hundreds of trades showed pattern reliability increases significantly when paired with volume and key zones.” — Emily Chen, Quant Analyst
Pocket Option makes it easier for traders to master candlestick analysis by providing a dedicated Guides and Tutorials section on trading strategies. Inside, you’ll find clear instructions on the most popular approaches, helping you to:
📈 Understand how to read candlestick charts the right way
🔑 Recognize the key candlestick patterns
📊 Follow step-by-step methods to forecast price movements more effectively
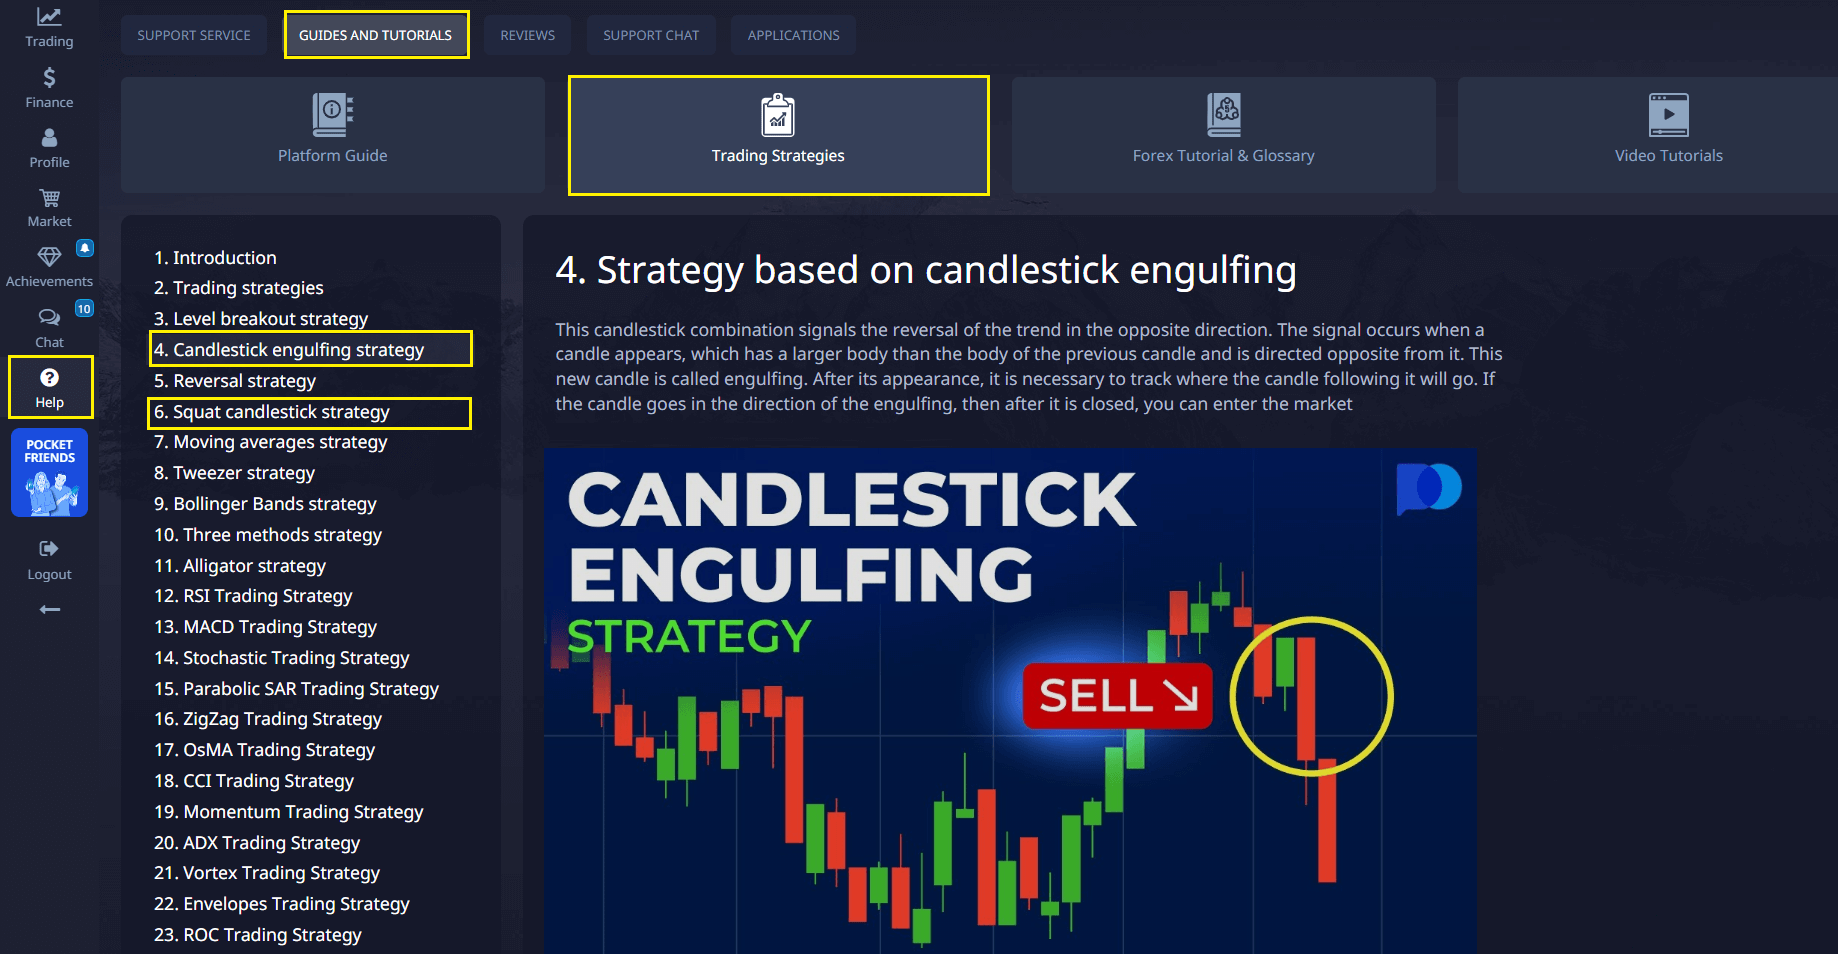
This section is a valuable resource for both beginners just starting out and experienced traders who want to sharpen their skills.
Strategic Implementation for Pocket Option Traders
| Element | Method |
|---|---|
| Pattern Verification | Confirm on 2+ timeframes |
| Risk Calculation | Fixed 1–2% per trade |
| Profit Targets | Based on ATR or support/resistance zones |
| Trade Timing | Avoid signals during low liquidity hours |
🎯 Put your knowledge to the test — open a Pocket Option account and trade your first pattern today!
Strategic Use of Best Candlestick Patterns Day Trading
Success with best candlestick patterns day trading doesn’t depend on memorizing dozens of shapes. It requires:
- Pattern + context
- Confirmation + discipline
- Execution + emotional control
FAQ
What makes candlestick patterns reliable for day trading?
Candlestick patterns reflect actual market participant behavior and emotions, showing supply and demand dynamics in real-time.
How much time should traders spend practicing pattern recognition?
Dedicated traders typically need 3-6 months of consistent practice to recognize patterns effectively and understand their reliability.
Which time intervals work most effectively for pattern analysis?
5-minute and 15-minute charts often provide the most reliable signals for day trading patterns.
Can traders combine candlestick patterns with technical indicators?
Yes, combining patterns with momentum indicators and volume analysis increases trading accuracy.
What percentage of patterns result in predicted outcomes?
Well-formed patterns in strong market conditions have approximately 60-75% success rates when properly validated.
What are the best candlestick patterns for day trading?
Doji formations, hammer patterns, engulfing structures, and morning star configurations are among the most effective patterns when validated with context and volume.
How accurate are candlestick patterns?
Depending on market conditions and confirmations, success rates range from 60% to 75%.
Which candlestick patterns work best?
Engulfing structures and hammer patterns offer the highest accuracy in volatile, trend-driven environments.
How to read candlestick patterns?
Analyze the body (open/close), shadows (high/low), and relative position in a trend. Combine with volume or indicators for reliability.
CONCLUSION
Whether you're using engulfing structures, morning star configurations, or automated pattern tools, consistency is what turns knowledge into profits.
Sign Up today!About the author :
Trading Strategies
Sign up for more like this
Customize your newsfeed with content you're actually interested in — get up-to-date personalized newsletter in your inbox.
Comments 1