- Open the “Current” tab in the same indicator menu and click the pen icon to adjust settings such as color, period, and line thickness.
- Alternatively, edit it directly from the chart by clicking the pencil icon next to the indicator’s name.
Pocket Option Pocket Option Volume Indicator

Updated on 15 Aug 2025
Volume indicators are key in trading analysis. This article explains how to use them effectively, compares similar tools, and provides a practical trading example.
Volume-Based Indicators on Pocket Option
The volume indicator in Pocket Option displays as a histogram beneath the price chart, with each bar representing total transactions for the corresponding price candle. Taller bars show higher participation, while shorter bars indicate reduced activity. Color differences highlight whether volume occurred during bullish or bearish price movement.
| Indicator | Description |
|---|---|
| Awesome Oscillator | Measures the momentum by comparing two moving averages; helps identify trend strength. |
| Bears Power | Shows the strength of sellers relative to a moving average; useful in downtrend confirmation. |
| Bulls Power | Reflects the strength of buyers above the moving average; often used in bullish setups. |
| MACD | Combines moving averages and histogram to assess market momentum and trend direction. |
| OsMA | Displays the difference between MACD and its signal line; highlights momentum shifts. |
| Rate of Change (RoC) | Calculates the speed of price change over a period; signals increasing or decreasing market interest. |
How to Enable the Volume Indicator on Pocket Option
On Pocket Option, traders have access to several volume-related tools directly from the trading interface.
Step-by-Step Activation and Management
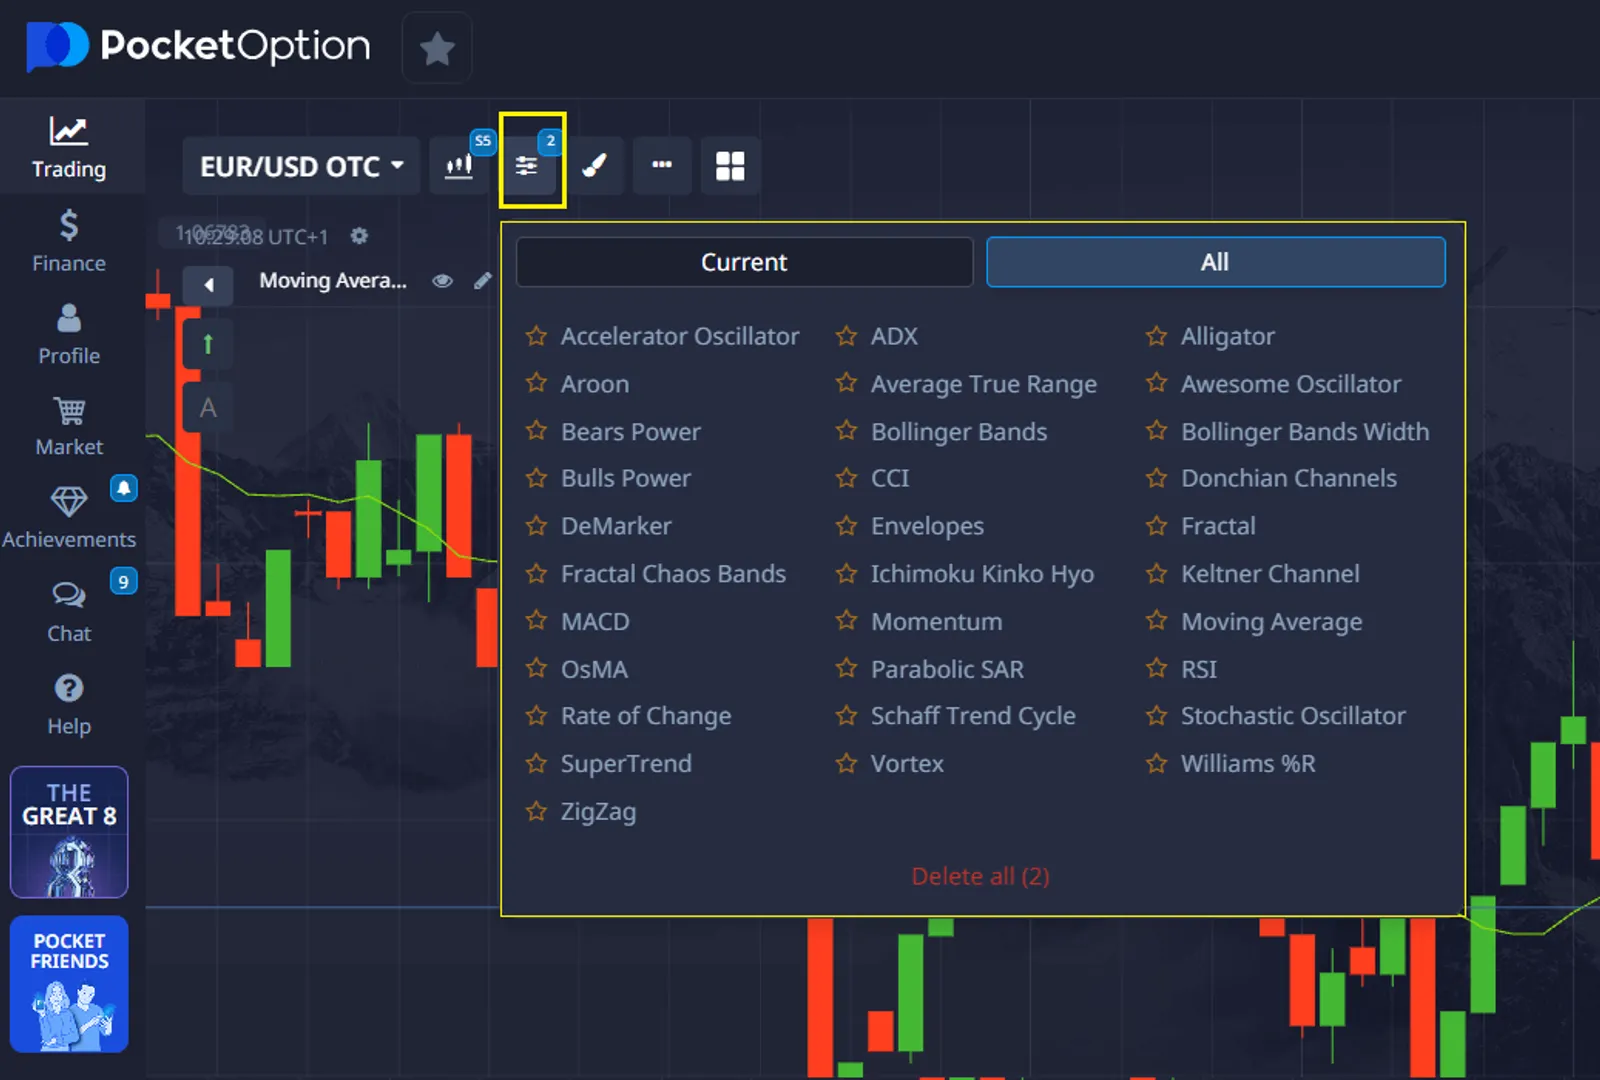
👉To add the volume indicator to your chart, open the “Indicators” tab located in the top-left corner of the interface and simply click on the desired indicator from the list.
Once applied, it can be customized in two ways:
If you plan to use this tool regularly, mark it with a star to move it into your Favorites section.
To remove the indicator, go to the “Current” tab in the indicator list and delete it from there. You can also remove it from the chart by clicking the X next to its name.
Using the Volume Indicator in Quick Trading
Volume indicators reflect the number of trades within a given period. This helps identify market activity and interest in an asset. In Quick Trading, a sudden spike in volume may indicate a potential breakout or reversal.
Example of Practical Use
Let’s walk through a realistic scenario using the Awesome Oscillator on Pocket Option, which reflects market momentum and indirectly relates to volume strength.
- Open the EUR/USD asset on the Pocket Option trading interface.
- Click on the Indicators tab in the top-left corner and select Awesome Oscillator.
- Observe the histogram bars at the bottom of the chart. A period of flat or mixed bars (red and green alternating near zero) indicates market indecision.
- Wait for a clear signal: two or more consecutive green bars increasing above the zero line suggest growing bullish momentum.
- At the same time, monitor the price action for a breakout candle, ideally a strong bullish candle following a short consolidation.
When both conditions are met:
- Awesome Oscillator turning green and rising.
- Price breaking above a recent resistance zone
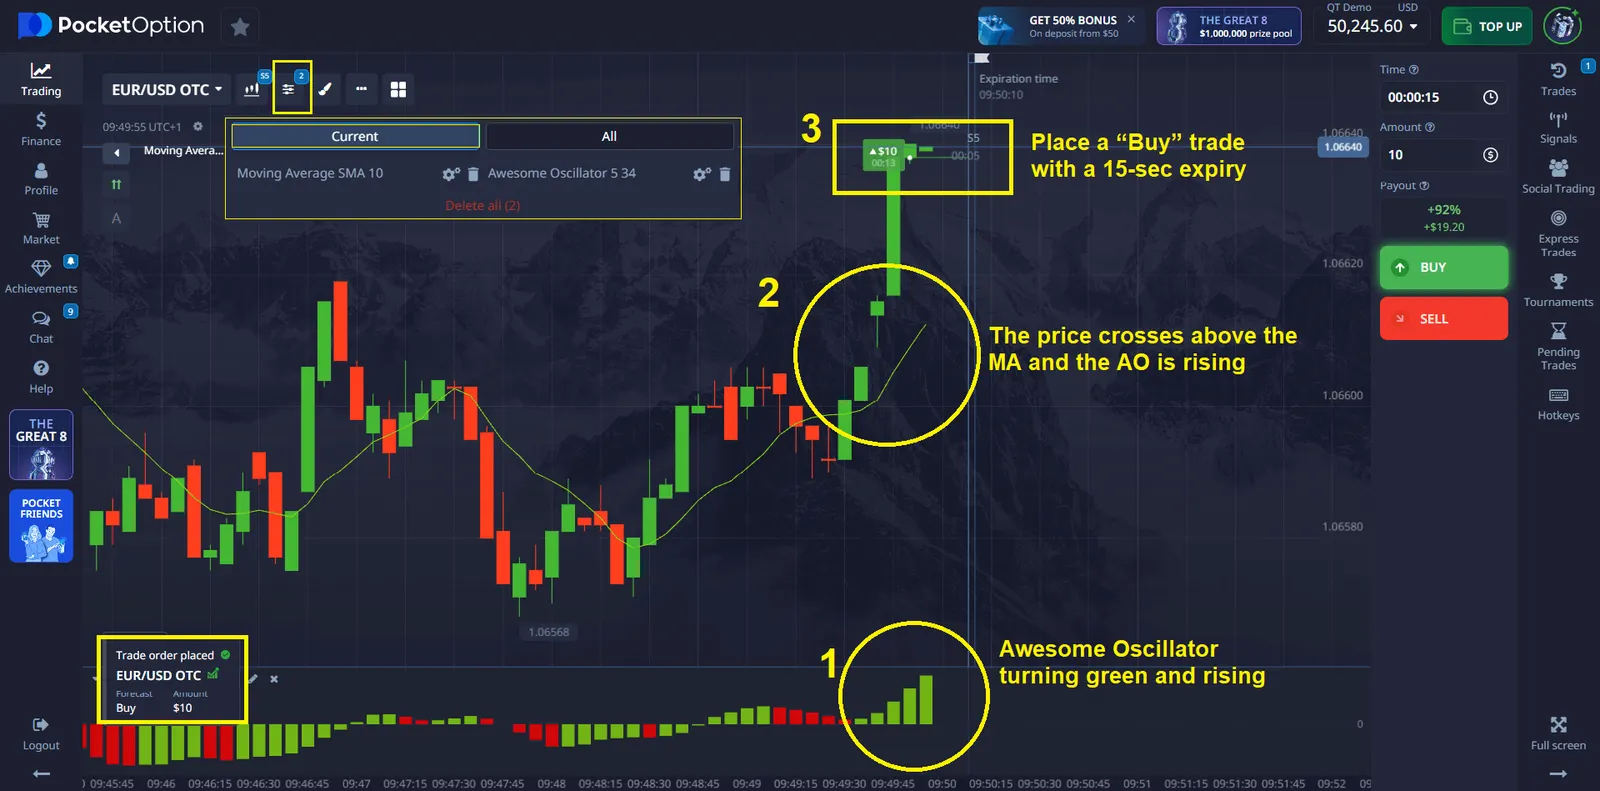
→ Place a “Buy” trade with a 15-sec expiry.
To improve accuracy, combine with Moving Average (MA):
- Add a short-period MA (e.g., 10) to your chart.
- If the price crosses above the MA and the AO is rising, this confirms the strength of the move.
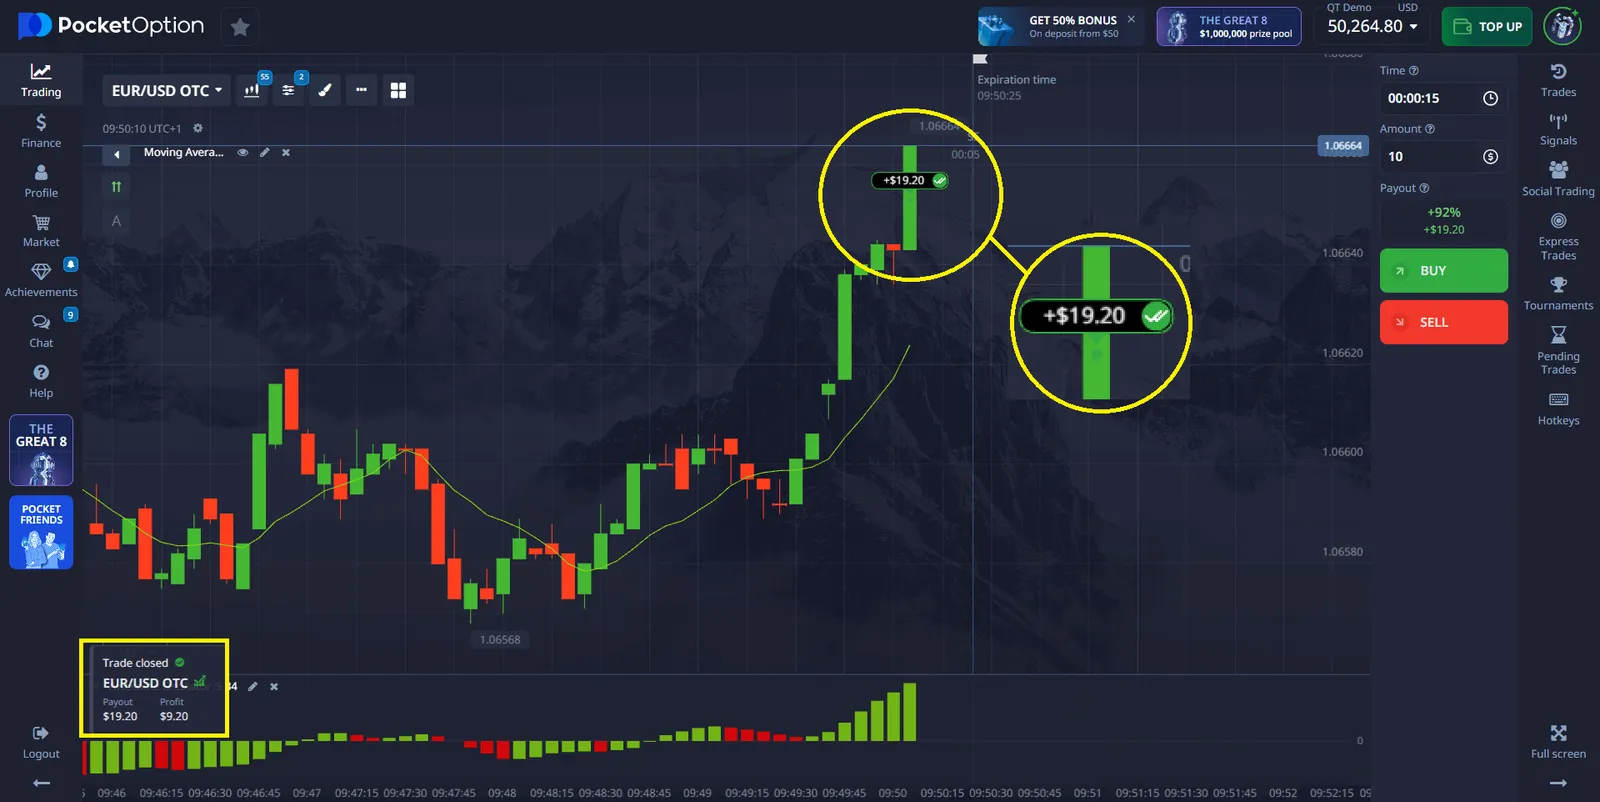
This dual confirmation helps filter out weak moves and supports structured decision-making.
👉In our example, by using two indicators and selecting a 15-second trade on EUR/USD OTC, we earned a 92% return from a $10 investment — that is, +$9.2 credited to the account.
How to Combine Volume Indicators with Other Tools to Find Entry Points
Volume indicators are rarely used in isolation. Traders often combine them with tools from other categories such as trend, momentum, or volatility indicators. Below is a comparison table showing how volume indicators can be paired for enhanced signal reliability:
| Volume Indicator | Additional Indicator | How to Read and Find Entry Points |
|---|---|---|
| Volume | Moving Average (MA) | Entry when volume spikes above average during a candle that breaks above the MA line. |
| Awesome Oscillator | RSI | Entry when AO shows a green bar after red, and RSI crosses above 30 from oversold. |
| Bulls Power | Fractal | Entry when Bulls Power is rising, and a buy fractal appears below price. |
| Bears Power | Parabolic SAR | Entry when Bears Power is increasing, and SAR dots flip to above the price, indicating sell. |
| MACD | Bollinger Bands | Entry when MACD lines cross up, and the candle breaks above the upper Bollinger band. |
| Rate of Change (RoC) | ADX | Entry when RoC turns upward sharply, and ADX is above 20, confirming a trend is forming. |
Each tool interprets volume differently. For example, Bulls/Bears Power isolates directional force, while MACD identifies convergence patterns based on volume-affected averages.
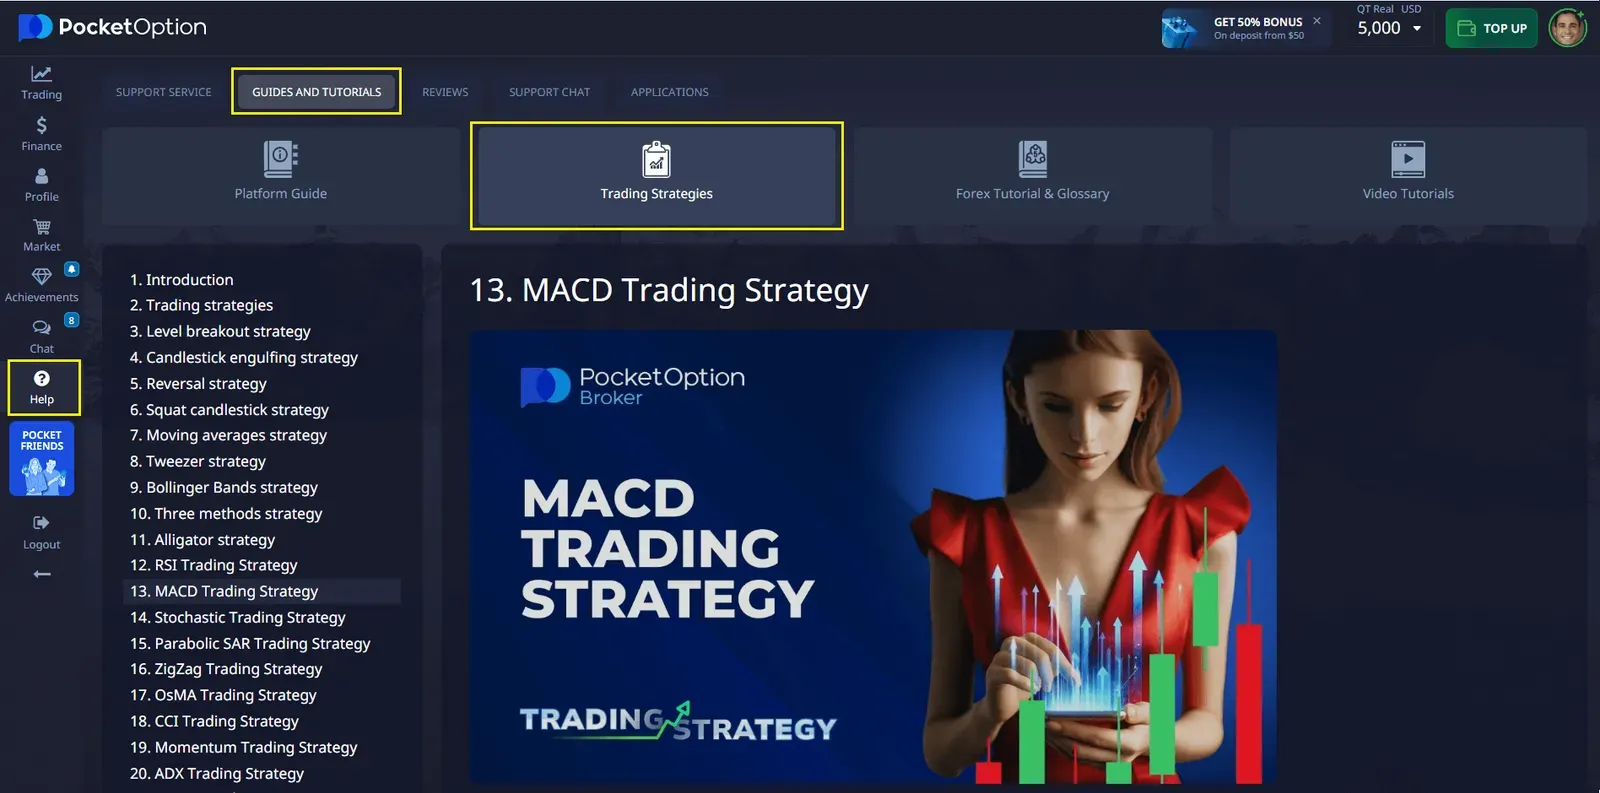
Accessing the Strategy Section on Pocket Option
Pocket Option features a dedicated Strategy tab where users can explore predefined trading techniques. Some of these strategies integrate volume indicators, providing structured methods to use them effectively.
Whether it’s a simple breakout confirmation strategy or advanced volume divergence, users can find helpful examples, including entry/exit conditions and indicator settings.
Limitations of the Volume Indicator
While volume-based tools offer insight, they also have limitations:
- Lagging Nature: Volume indicators react after the price changes.
- Lack of Direction: They do not inherently predict bullish or bearish trends.
- Asset Dependency: Volume data may vary in reliability across OTC, forex, and crypto assets.
These aspects require cautious interpretation and combination with other tools.
Volume Indicators vs. Price-Only Strategies
Some traders rely solely on candlestick patterns or moving averages. Volume indicators provide additional context but should not replace price analysis. A combined approach is often more effective for identifying valid signals and avoiding false breakouts.
Summary and Final Thoughts
Volume indicators are a useful, though not definitive, component of trading analysis. On Pocket Option, traders can easily activate and customize them. However, understanding their context, limitations, and how to combine them with other tools is key to meaningful application.
FAQ
Is the volume indicator available on mobile?
Yes, Pocket Option allows volume indicators on both desktop and mobile platforms through the “Indicators” menu.
Can I use multiple volume indicators at once?
Yes, traders can activate several tools (e.g., Volume + MACD) to form a more complete strategy.
How accurate is the volume indicator for quick trading?
It offers supportive data but should be combined with price patterns or confirmation indicators for better results.
Are volume indicators available in the strategy section?
Yes, the strategy section includes several methods that rely on volume or combine it with trend signals.
Which assets show the most reliable volume data?
Major forex pairs and stocks tend to reflect more accurate volume activity compared to less-liquid or OTC instruments.
Trading platforms
Sign up for more like this
Customize your newsfeed with content you're actually interested in — get up-to-date personalized newsletter in your inbox.
Your comment
Comments are pre-moderated to ensure they comply with our blog guidelines.