- Organic volume (e.g., user transfers, DEX trades, NFT sales) shows healthy user engagement.
- Suspiciously high volume without user growth can signal manipulation — common in low-liquidity altcoins.
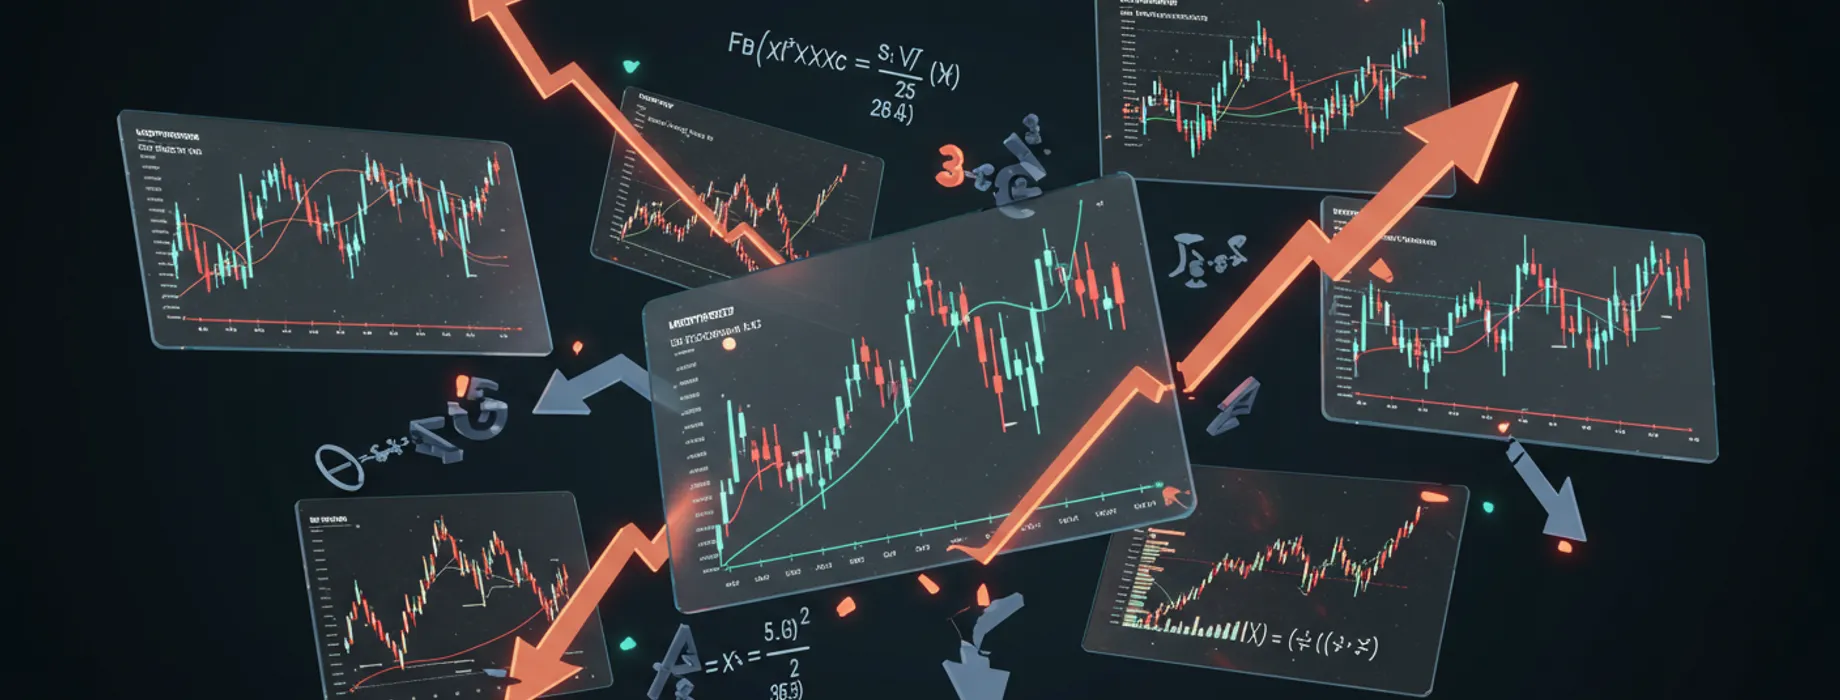
Blockchain On-Chain Analysis for Crypto Trading

12 min to read
Updated on 03 Sep 2025
In the ever-evolving world of cryptocurrency, having an edge often means going beyond traditional price charts and indicators. On-chain analysis—a method of examining data directly from blockchain networks—has emerged as a powerful tool for understanding market behavior at a granular level. It offers traders insights into the actual usage, movement of assets, and behavioral patterns of participants that price action alone cannot reveal.
Article navigation
- What Is On-Chain Analysis?
- ✔ Essential On-Chain Metrics: What They Reveal
- MVRV (Market Value vs. Realized Value)
- 5 Whale Tracking and Behavioral Patterns
- Protocol-Level Data Interpretation
- Staking Participation and Governance
- TVL (Total Value Locked)
- Developer Activity
- Transaction Volume and Velocity Metrics
- 🔗 Whale Watching and Token Concentration
- 💷 Case Example:
- 🍀 Caution:
- 🍀 Exchange Flows and Wallet Movements
- 🍀 Exchange Inflows
- 💷 Exchange Outflows
- Tracking Tools
- Smart Strategy Use:
- Network Value and Economic Throughput
- Tools:
- Strategic Takeaway:
- Whale Tracking and Wallet Clustering
- Wallet Clustering
- Key Metrics to Track
- Tools:
- Strategic Takeaway:
- Transaction Analysis and Flow Mapping
- Key Concepts
- What to Watch
- ✕ Tools for Flow Analysis
- ☑ Strategy in Action
- 📅 Common Mistakes
- 📝 Conclusion
- 🔍 Sources
Whether you’re tracking large wallet movements, monitoring token inflows to exchanges, or evaluating the health of a blockchain ecosystem, on-chain metrics provide a unique window into what’s happening behind the scenes. For binary options and spot traders alike, integrating blockchain analysis into your strategy can improve timing, sharpen risk assessment, and uncover signals missed by conventional technical tools.
This guide explores the essential metrics, frameworks, and practical strategies for leveraging on-chain data to make smarter trading decisions in crypto markets.
What Is On-Chain Analysis?
On-chain analysis refers to the examination of data recorded directly on public blockchains. Unlike technical analysis, which interprets historical price movements, or fundamental analysis, which evaluates project viability, on-chain analysis dives into the real-time behavior of users, miners, and network validators. It uses data such as wallet balances, transaction flows, exchange inflows/outflows, and smart contract activity to assess the health and sentiment of a crypto asset.
Because blockchain data is transparent and immutable, traders can observe the exact movements of large holders (often referred to as “whales”), analyze network activity spikes, or detect early signs of capitulation or accumulation. This makes it particularly valuable in highly speculative markets like crypto, where news cycles and emotional trading often distort the true picture.
Modern on-chain platforms allow users to track these metrics visually and apply them contextually to their strategies. As institutional adoption increases, so does the value of on-chain data as a way to interpret crowd psychology, anticipate volatility, and refine entries and exits.
✔ Essential On-Chain Metrics: What They Reveal
Mastering on-chain trading begins with decoding the raw data written on blockchains. These aren’t just numbers — they’re behavioral signals, showing what different market participants are doing in real time. Here’s how to read the most telling metrics:
✔ Unique Active Wallets
This reflects how many addresses are participating in transactions daily. A rise may indicate user growth, adoption, or speculative activity. A sharp drop? Possible disengagement or declining demand.
✔ Exchange Wallet Movements
When large sums flow into exchanges, it often means traders are preparing to sell — a potential bearish flag. Outflows, especially during dips, can suggest accumulation and a bullish outlook.
✘ Large Holder Transfers
Big wallets (aka whales) tend to move quietly but leave massive footprints. Noticing consistent buys from these addresses often precedes price rallies. Spotting distribution? Might be time to tighten risk.
✔ NVT (Network Value to Transactions)
Think of it as a crypto version of the P/E ratio. If market cap balloons but transaction volume doesn’t follow — the asset might be overpriced relative to real usage.
✘ Gas Fees and Congestion
Skyrocketing transaction fees, particularly on networks like Ethereum, hint at a frenzy — NFT launches, hype-driven DeFi projects, or panic selling. High fees = network stress = volatility.
MVRV (Market Value vs. Realized Value)
This metric compares the current market cap to the aggregate price users paid for their coins. High MVRV values may suggest profit-taking zones; low values can flag oversold conditions.
Individually, these metrics are useful — but together, they paint a high-resolution image of market psychology.
5 Whale Tracking and Behavioral Patterns
In the world of crypto, not all wallets are created equal. A small group of high-capital entities — often referred to as “whales” — can significantly sway markets. On-chain analysis gives traders a rare chance to observe their movements in real time, revealing powerful sentiment signals.
Exchange Inflows from Whales
When large wallets transfer assets to centralized exchanges, it’s often a preparation for liquidation. Tracking these inflows can help anticipate selling pressure before it hits the charts.
Cold Wallet Accumulation
If whales are consistently moving funds from exchanges to cold storage, it suggests long-term conviction and reduced short-term selling risk — a bullish signal, especially during price consolidation phases.
“Smart Money” Distribution
Sudden transfers from multiple large wallets to exchanges during pumps may point to coordinated exits. Recognizing these shifts early can help retail traders avoid buying into tops.
Wallet Labeling Tools
Modern on-chain platforms like Nansen and Arkham Intelligence help identify wallet owners or behavioral patterns by tagging exchange wallets, institutional players, and active DeFi participants. These tools enable traders to monitor whale behavior with greater precision.
Example:
A notable case occurred before Bitcoin’s drop in May 2021 — several whale wallets began sending BTC to exchanges in unusually high volumes days before the price decline, signaling insider exits.
Understanding how whales move their assets is like reading the footprints of market-moving players. These insights often come before price reacts, giving on-chain analysts a distinct advantage.
Protocol-Level Data Interpretation
Beyond wallet activity, each blockchain protocol generates a wealth of internal metrics that reflect its health, user engagement, and economic activity. These protocol-specific insights can be invaluable when evaluating both short-term sentiment and long-term potential.
Staking Participation and Governance
For proof-of-stake chains, the proportion of tokens staked often signals network confidence. A rising staking ratio implies user commitment and belief in network security. Additionally, high governance participation (e.g., votes on DAO proposals) can indicate an active, invested community.
Fee Revenue and Gas Utilization
Blockchains like Ethereum or Solana generate protocol fees — a direct indicator of usage. Surging gas fees during peak periods reflect demand pressure. Tracking fee trends helps distinguish hype from sustainable utility.
TVL (Total Value Locked)
In DeFi ecosystems, TVL measures how much capital is actively engaged in smart contracts. A growing TVL, especially on newer protocols, shows rising market trust. But if TVL climbs without matching user activity or volume, it may indicate unsustainable incentives.
Developer Activity
Development metrics from GitHub or blockchain-specific tools (e.g., Electric Capital reports) provide context on protocol maturity. Consistent code commits and ecosystem upgrades signal innovation — key for identifying long-term holds.
Example:
During the 2021 bull run, Avalanche’s TVL exploded, driven by strong staking incentives. However, a simultaneous rise in developer activity and consistent wallet growth confirmed that the interest wasn’t purely mercenary.
Protocol-level data offers a window into the real engine of a blockchain — its infrastructure, usage, and sustainability. Traders who dig deeper than price often spot winning trends early.
Transaction Volume and Velocity Metrics
Understanding how funds move through a blockchain is essential to identifying shifts in market sentiment, liquidity cycles, and the emergence of new trends. Transaction volume and velocity are two key indicators that offer deep insight into the flow of capital.
Transaction Volume: Real vs. Wash
Total transaction volume measures the raw throughput on a network. However, traders must differentiate between organic volume and wash trading or automated activity.
Velocity of Money
Velocity refers to how quickly tokens change hands. A high velocity implies active usage and trading, while low velocity suggests hoarding or long-term holding.
- Rising velocity during a price rally can suggest retail speculation or short-term trading interest.
- Falling velocity while price climbs may indicate accumulation by whales or institutions.
☑ Metric Interplay Example:
In early 2023, BNB Chain saw declining velocity but rising price and volume — a sign of accumulation by large holders ahead of ecosystem upgrades.
📍 Layer 2s and Bridges
With cross-chain infrastructure and rollups becoming common, it’s important to also track transaction flow between chains. A surge in volume moving from Ethereum to Arbitrum, for example, often signals upcoming trading activity on the L2.
🔗 Whale Watching and Token Concentration
In decentralized markets, large holders—often called “whales”—can significantly sway price movements. Monitoring their behavior is a critical component of on-chain analysis.
🚀️ Whale Wallet Tracking
Whales are wallets holding large amounts of a specific token (typically top 1–5% by holdings). By tracking their actions, traders can anticipate large inflows/outflows before they impact price.
- Accumulation: If whales are steadily increasing holdings during a dip, this may signal a reversal or long-term bullish expectation.
- Distribution: Rapid outflows from top wallets near local tops often precede sharp corrections.
🚀️ Token Distribution Metrics
Token concentration offers a window into market stability or fragility.
- High concentration = more control by a few entities (e.g., insider-driven or VC-heavy projects).
- Low concentration = more decentralization and potentially more organic growth.
Metric Tip:
Tools like Nansen or Lookonchain allow real-time tracking of labeled wallets (e.g., exchanges, funds, insiders).
💷 Case Example:
Before the 2021 Shiba Inu rally, a handful of wallets began accumulating billions of tokens over a two-week period. The price exploded shortly after, validating the whale behavior as a lead indicator.
🍀 Caution:
Not all large wallets are whales — some are exchanges, staking pools, or bridge contracts. Proper tagging and attribution are vital to avoid misreading the data.
🍀 Exchange Flows and Wallet Movements
Exchange inflows and outflows are powerful real-time indicators of market sentiment. They reflect traders’ intent to sell, hold, or accumulate based on the behavior of funds moving on- and off-exchange.
🍀 Exchange Inflows
Large amounts of crypto being sent to exchanges often signal potential sell pressure. Traders or whales might be preparing to realize profits, cut losses, or rotate capital.
- Sudden spikes in inflows during rallies may precede local tops
- Consistent inflows during downtrends often correlate with panic selling
💷 Exchange Outflows
Conversely, large outflows (especially to new or cold wallets) indicate accumulation or long-term holding intentions.
- Outflows after price corrections may suggest whale buy zones
- Decreasing exchange reserves across multiple platforms often correlate with bullish momentum
Tracking Tools
- CryptoQuant, Glassnode, Santiment — for exchange balance dashboards
- LookIntoBitcoin — historical overlays of exchange flows with price charts
Smart Strategy Use:
During market uncertainty, monitor stablecoin exchange inflows too. A spike in USDT or USDC deposits might front-run buying pressure for major assets like BTC or ETH.
Watch Out For:
- Internal exchange transfers or maintenance flows can create noise.
- Rely on aggregated data across exchanges to filter out anomalies.
Network Value and Economic Throughput
Understanding the underlying economic activity on a blockchain is key to identifying true utility, adoption trends, and whether price action is backed by real fundamentals.
NVT Ratio (Network Value to Transactions)
The NVT ratio compares a crypto asset’s market cap to the total USD volume transmitted on-chain. It’s often dubbed the “P/E ratio” of crypto.
- High NVT = potentially overvalued (price rising faster than usage)
- Low NVT = potentially undervalued (network activity is outpacing price)
Example:
When Bitcoin’s NVT rises while price rallies, it might hint at an overheated move lacking on-chain support.
Adjusted Transaction Volume
Raw transaction counts can be misleading (spam, small transfers). Instead, we look at:
- Adjusted TX volume (filtering out self-sends)
- Value-adjusted activity (considering USD value of each transaction)
These metrics reflect true network usage and capital throughput.
Tools:
- Glassnode — NVT, Adjusted TX Volume, Velocity charts
- IntoTheBlock — Value moved by transaction size tiers (e.g. whale volume vs. retail)
Strategic Takeaway:
Combine NVT with volume delta and trend filters to validate whether a breakout is supported by real capital flow or driven by speculation alone.
Whale Tracking and Wallet Clustering
In crypto markets, whale behavior often precedes major price movements. Monitoring large wallet addresses and clustering related wallets offers a deep edge for directional bias and risk-on/risk-off shifts.
Who Are the Whales?
Whales typically include:
- Early investors
- Hedge funds and institutions
- Large OTC traders
- Protocol treasuries
Their actions—accumulation, distribution, long dormancy—can telegraph intent before it’s reflected in the market.
Wallet Clustering
Blockchain analysis tools can group addresses that likely belong to the same entity based on:
- Input co-spending
- Behavioral patterns
- Heuristic linking
Example: A cluster of addresses consistently sending coins to a known exchange wallet may indicate a coordinated sell.
Key Metrics to Track
| Metric | Insight |
|---|---|
| Whale accumulation zones | Areas where large players consistently buy |
| Exchange inflows/outflows | Whales moving funds to/from CEXs |
| Dormant supply shift | Long-held tokens becoming active |
Tools:
- Whalemap.io – Real-time whale cluster zones
- Santiment – On-chain social + whale flow combo
- Nansen – Entity tagging, smart money dashboards
Strategic Takeaway:
Look for divergence between retail activity and whale flows. For example, if whales are quietly accumulating while retail is fearful, it may signal a hidden bottom.
Transaction Analysis and Flow Mapping
To go beyond surface-level metrics, transaction flow mapping allows traders to trace the origin, destination, and intent behind major on-chain movements. It’s a forensic approach to understanding capital behavior.
Key Concepts
- Transaction Clustering: Grouping related transfers to identify pattern behavior (e.g., whale-to-exchange-to-DEX swap).
- Temporal Flow Analysis: Studying the timing of inflows/outflows to forecast liquidity cycles and event-driven trading.
- Smart Contract Interaction: Detecting how tokens move through DeFi protocols, staking contracts, or automated market makers (AMMs).
What to Watch
| Type of Flow | Implication |
|---|---|
| Wallet → Exchange | Possible sell pressure incoming |
| Exchange → Wallet | Accumulation, long-term holding |
| Wallet → DeFi Protocol | Yield farming, leveraged positioning |
| DEX Swap (Token A → B) | Rotation or hedging strategy |
✕ Tools for Flow Analysis
- Arkham Intelligence – Entity identification & visual flow charts
- DeBank & Zapper – Wallet-level DeFi movement
- Dune Analytics – Custom flow queries (e.g., whale transactions before major events)
☑ Strategy in Action
Before the Curve Finance exploit in 2023, flow analysis revealed a spike in stablecoin movement from Curve LPs to centralized exchanges — a precursor to the liquidity crunch that followed.
📅 Common Mistakes
- Misinterpreting bridge activity as sell pressure
- Ignoring gas-efficient batch transfers (used by whales or funds)
📝 Conclusion
On-chain analysis has emerged as a critical tool in modern cryptocurrency trading. By dissecting blockchain activity—transaction flows, wallet behavior, and network metrics—traders gain a real-time view of market dynamics often hidden from traditional chart-based analysis. When combined with social sentiment and technical strategies, on-chain data offers a robust edge in a volatile and often speculative market. For serious traders, developing a workflow that integrates on-chain signals is no longer optional—it’s a competitive necessity.
Keep testing, stay curious, and remember: the blockchain never lies.
🔍 Sources
- QuantInsti – Machine Learning for Trading
- CBOE – Understanding Market Microstructure
- BIS – Algorithmic Trading Practices
FAQ
What are the most important on-chain metrics for traders?
The most relevant on-chain metrics include active addresses, transaction volume, exchange inflow/outflow, realized cap, and MVRV ratio. These indicators offer insight into market participation, sentiment, and investor behavior.
Can whale tracking predict market moves?
While not a guarantee, whale movements can serve as strong market signals. Large inflows to exchanges may precede selling pressure, while withdrawals often indicate accumulation or long-term holding.
How reliable is on-chain data for short-term trading?
On-chain data is generally more suited for medium- to long-term analysis. For short-term strategies, combining it with technical indicators or real-time sentiment data yields better results.
Are there risks to relying too much on on-chain data?
Yes. On-chain data can lag, and interpreting it without broader context may lead to false conclusions. It should be used as part of a multi-dimensional trading approach.
Which platforms offer the best on-chain analytics?
Notable platforms include Glassnode, CryptoQuant, Santiment, and Nansen. Each offers a unique blend of metrics, dashboards, and custom alerts.
About the author :
Markets
Sign up for more like this
Customize your newsfeed with content you're actually interested in — get up-to-date personalized newsletter in your inbox.
Your comment
Comments are pre-moderated to ensure they comply with our blog guidelines.