
Pivot Points Trading Strategy
A seesaw has one fixed point holding the whole thing up, the fulcrum, and everything else on the board gets measured relative to that one spot. Move a rider two feet from it, three feet, the board tips differently depending on the distance. Markets build something similar out of yesterday's trading, a single calculated center point, with a handful of marked distances above and below it where price often behaves a little differently than it does everywhere else.

Why Traders Watch These Levels
Pivot points are a set of calculated levels built from the previous session's trading range, used to estimate where price might find support, resistance, or a reason to reverse during the current session. Nothing about pivot points predicts anything with certainty. They just give traders a fixed, objective reference instead of eyeballing a chart and guessing where support and resistance ought to sit.
Intraday traders lean on pivot points especially heavily, since the levels reset every session and hand each day a fresh set of coordinates to work with. None of that makes them a ready-made signal. A price touching a pivot level is not an instruction to buy or sell. It is just a spot worth paying closer attention to.
Open a free demo account and watch how price reacts around calculated levels, using virtual funds.
Try Demo AccountCurious how price actually behaves once it reaches one of these calculated levels on a live chart? Reading about pivot levels only goes so far. Watching price approach one, react, and either hold or break through in real time teaches the pattern faster than any description can.
Open a demo trading account and watch how price behaves around a few calculated levels, with virtual funds and nothing real on the line.
How the Main Levels Are Calculated
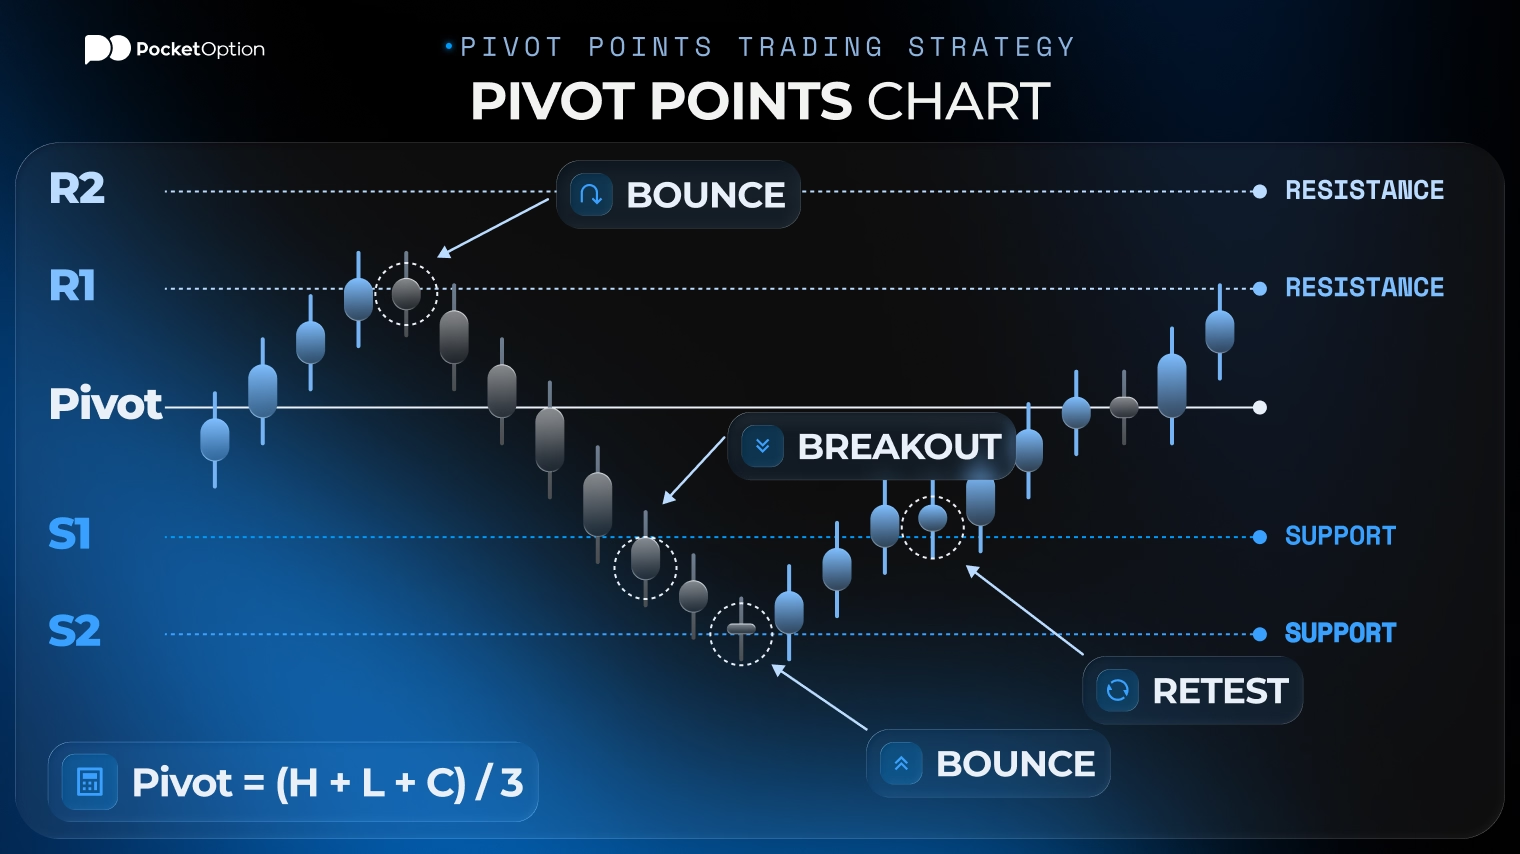
The standard calculation is deliberately simple. Take the previous session's high, low, and close, add them together, divide by three, and that average becomes the central pivot. Support and resistance levels get built outward from that single number using the same three inputs in different combinations. R1 typically equals double the pivot minus the previous low. S1 typically equals double the pivot minus the previous high. R2 and S2 stretch further out using the full high-low range added to or subtracted from the pivot.
Say yesterday's high was 1.0950, low was 1.0870, and close was 1.0910. The pivot lands at 1.0910. R1 comes out near 1.0950, and S1 near 1.0870, roughly mirroring yesterday's own extremes back onto today's chart. A camarilla pivot points formula follows a related but distinct logic, weighting the previous close more heavily and producing tighter levels meant specifically for intraday reactions rather than the wider standard set. Working through that arithmetic on a real chart makes it click faster than any writeup, and the pocket option tutorial is a fine place to get comfortable with chart basics first if any of this still feels unfamiliar.
What R1, S1, R2 and S2 Mean
R-levels get treated as resistance zones, spots where upward moves have some tendency to stall. S-levels get treated as support, where downward moves have some tendency to hold. Whether either actually happens depends entirely on context. A quiet session with light volume behaves nothing like a session running into major news. The relationship between price action and pivot points only becomes useful once you stop expecting every line to act like a wall and start reading how price actually behaves once it arrives there.
Standard, Fibonacci, Woodie and Camarilla Methods
Standard is not the only formula in circulation. Fibonacci-based versions apply Fibonacci ratios to the day's range instead of simple fractions. Woodie pivot points weight the current session's opening price more heavily than the standard method does. Camarilla produces a tighter cluster of levels aimed at shorter intraday reactions. None of this needs deep study to use sensibly. It just means checking which formula a chart or platform is actually running before assuming every trader looking at the same chart is looking at the same numbers you are.
Reading Price Action Around Key Zones
A level by itself is just a number sitting on a chart. What happens when price actually arrives there is the part worth watching closely. A candle closing firmly through a level suggests real conviction. A rejection wick right at the level suggests the opposite. A retest that holds after an initial touch adds confidence either way. A false breakout, where price pokes through and immediately snaps back, is common enough near these levels that treating any single touch as decisive is a mistake. A fibonacci pivot points formula setup gets read exactly the same way as a standard one at this stage, since the reading skill lives in the price action itself, not in which formula generated the line.
Intraday Scenarios Traders Often Watch
A handful of scenarios repeat often enough to be worth naming, purely as educational patterns rather than a ready strategy. Price opening near the central pivot and drifting toward R1 or S1 as the session develops. Price breaking cleanly through R1 or S1, retesting that same level from the other side, and continuing in the breakout direction. Price rejecting R1 or S1 outright and drifting back toward the central pivot instead. None of these come with a guaranteed outcome attached. Watching how forex pivot points behave across a handful of real sessions teaches the shape of these scenarios far faster than reading a list ever could.
Using Them in Forex Without Narrowing the Article
Forex leans on this particular pivot points trading approach more than most other markets, mainly because major pairs trade intraday around the clock and support and resistance reactions show up constantly during active sessions. That popularity does not make the approach forex-exclusive.
The same pivot points trading logic applies just as directly to stocks, indices, and crypto, wherever a previous session's range exists to calculate from and traders are watching for reactions at calculated levels rather than eyeballed ones.
Calculated Levels vs Manual Support and Resistance
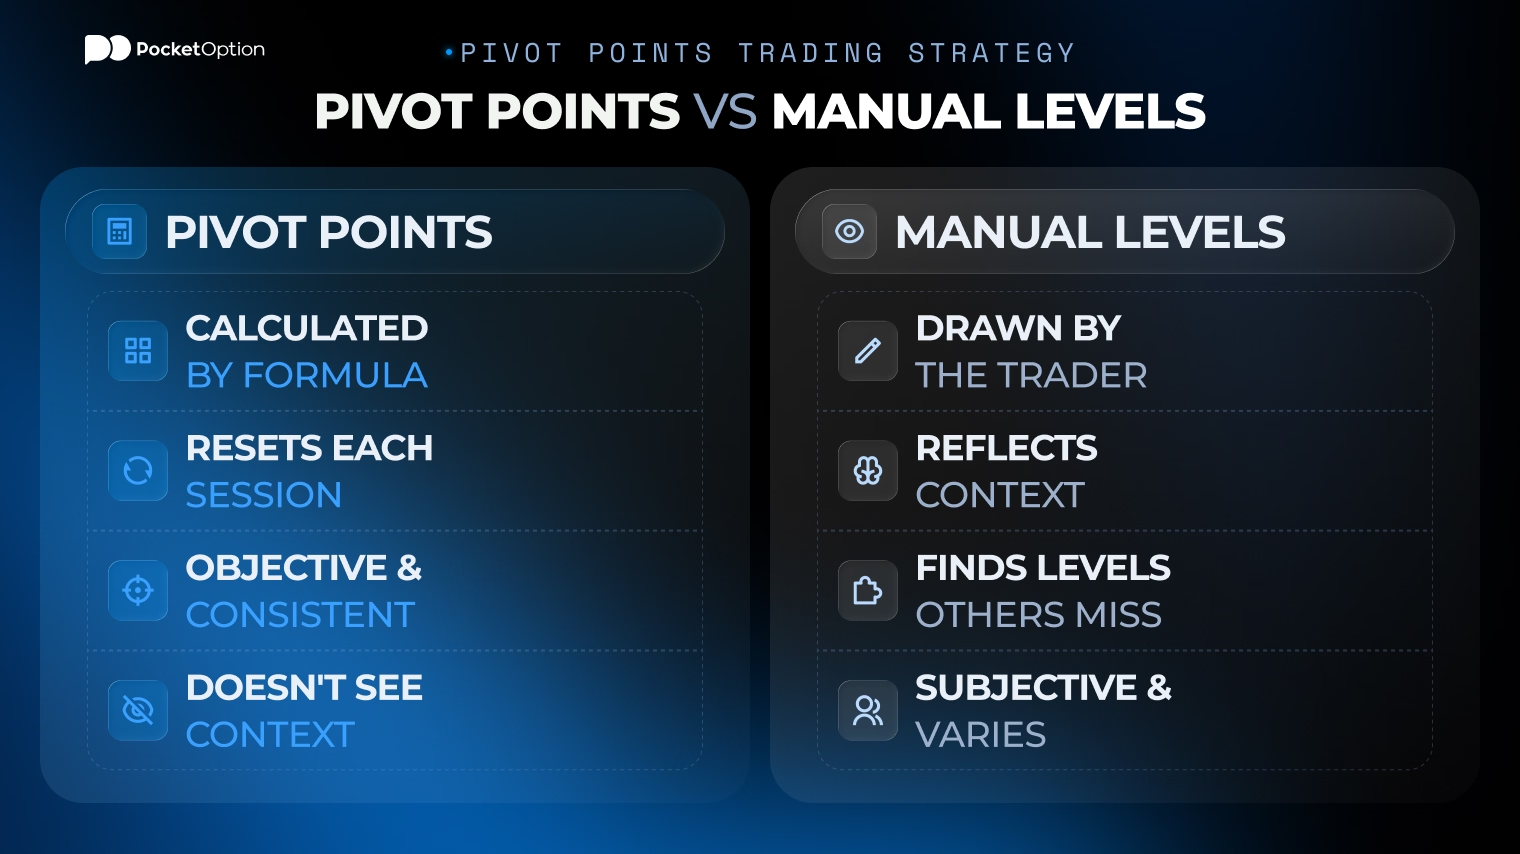
Calculated levels and hand-drawn support and resistance solve a similar problem from different directions.
Feature | Calculated Pivot Levels | Manual Support/Resistance |
|---|---|---|
How Created | Formula based on prior high, low, close | Drawn by eye from chart history |
Use Case | Fast, consistent, resets each session | Reflects levels the trader finds meaningful |
Strength | Objective, same for every chart using the formula | Can capture levels a formula would miss entirely |
Limitation | Ignores context a human eye would catch | Subjective, varies trader to trader |
Camarilla pivot points specifically lean further toward the objective side of that trade-off, since the tighter formula leaves even less room for interpretation than the standard method already does.
Mistakes That Make the Signals Weak
The same handful of habits weaken a pivot points forex setup, or any other market's version of the same idea, in fairly predictable ways.
Trading a level the instant price touches it, with no confirmation of any kind.
Ignoring the broader trend and treating every pivot level as a reason to fade the move.
Entering directly at a level without any plan for where the idea is proven wrong.
Mixing up formula types and comparing levels that were never meant to line up.
Ignoring scheduled news or unusual volatility that can blow straight through any calculated level.
Expecting every single line to produce a clean, predictable reaction every time price arrives there.
Risks Before Trading These Levels
Price can break straight through a pivot level with no reversal at all, especially during a strong trend or a major news release. Different formulas produce different levels for the exact same chart, so comparing levels calculated two different ways can create a false sense of agreement or disagreement. Leverage magnifies losses on a level that fails just as it magnifies gains on one that holds. And no calculated level, regardless of formula, can account for a genuine shift in market conditions happening in real time.
Risk Disclaimer: Trading involves significant risk of capital loss. This article is for educational purposes only and does not constitute financial advice. Always conduct independent research and consider your risk tolerance before making any trading decisions.
Ver más:InterestingTrading Strategies