What Is a Bull Trap in Trading?
A fishing lure is built to look exactly like something worth chasing, a wounded baitfish, easy prey, no danger anywhere in sight. A fish strikes because everything about that lure says opportunity. The hook only reveals itself after the bite, and by then the decision is already made. Markets bait traders with something similar. Price pushes above a level, looking exactly like the start of a real move higher, and traders bite. The reversal that follows is the hook nobody saw coming.

Why Traders Fall Into Bull Traps
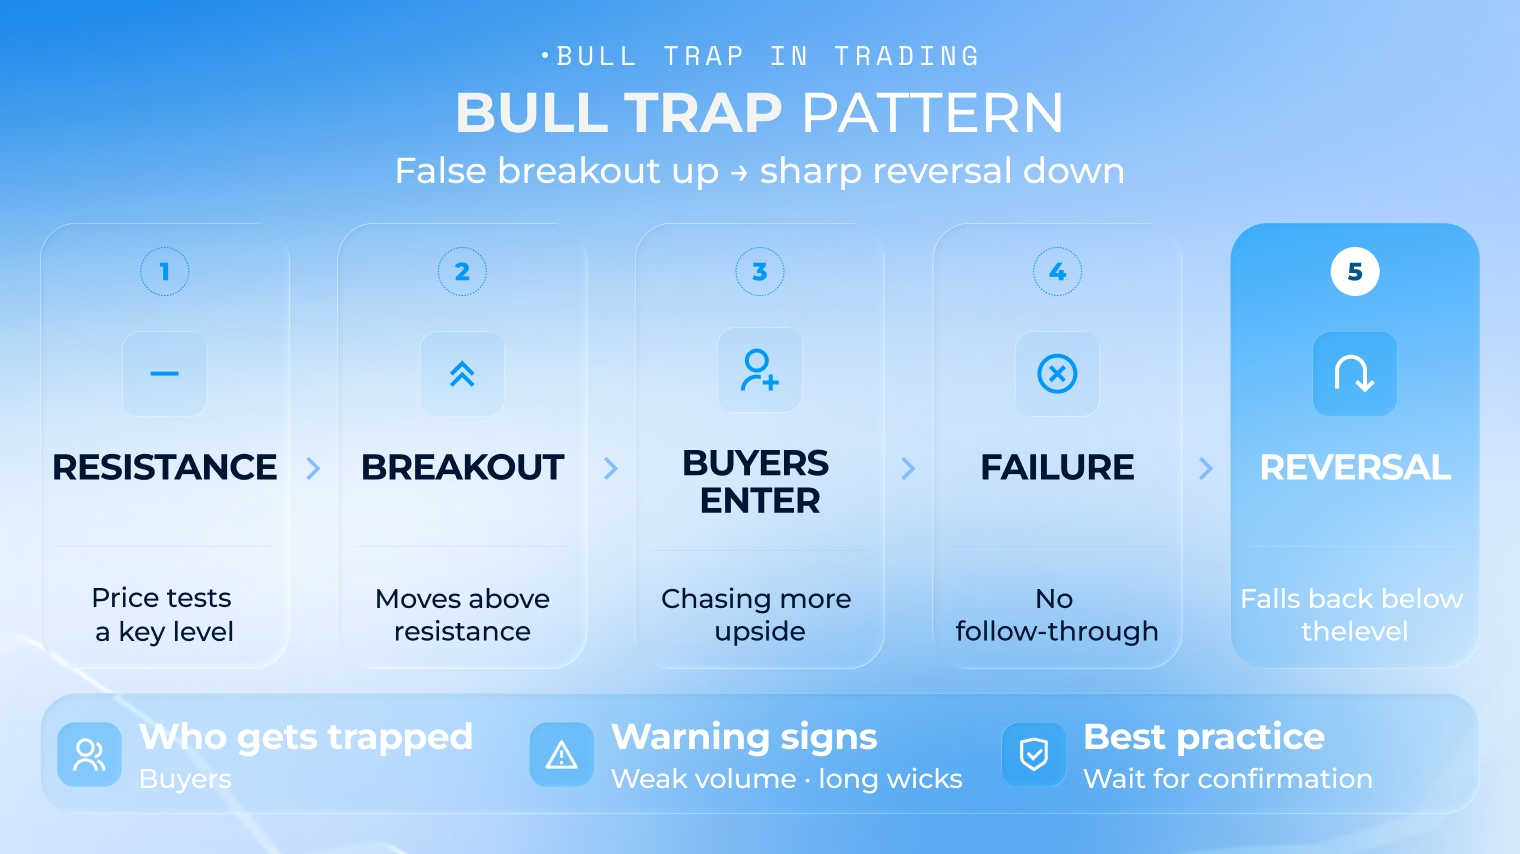
A bull trap forms when price pushes above a resistance level or flashes some other signal of strength, then fails to hold that move and reverses hard back down, catching everyone who bought expecting more upside. The bait looked completely convincing in the moment. Price broke a level traders had been watching. Momentum seemed to be building. None of that guaranteed anything, and a bull trap is exactly what happens when the gap between how convincing a signal looks and how reliable it actually is gets exploited.
Weak confirmation and emotional entries are usually what turn an ordinary false breakout into a full bull trap. See a level break, feel the fear of missing the move, buy immediately, and there is no time left to notice the warning signs that were probably already there. The trap does not spring on the traders paying attention. It springs on the ones who bit the moment the bait appeared.
Curious what one of these false breakouts actually looks like as it unfolds candle by candle? Reading about the pattern only goes so far. Watching a real breakout stall and reverse, live, teaches the shape of a trap faster than any description can.
Open a demo trading account and watch a few breakouts play out in real time, with virtual funds and nothing real on the line.
How a False Breakout Forms
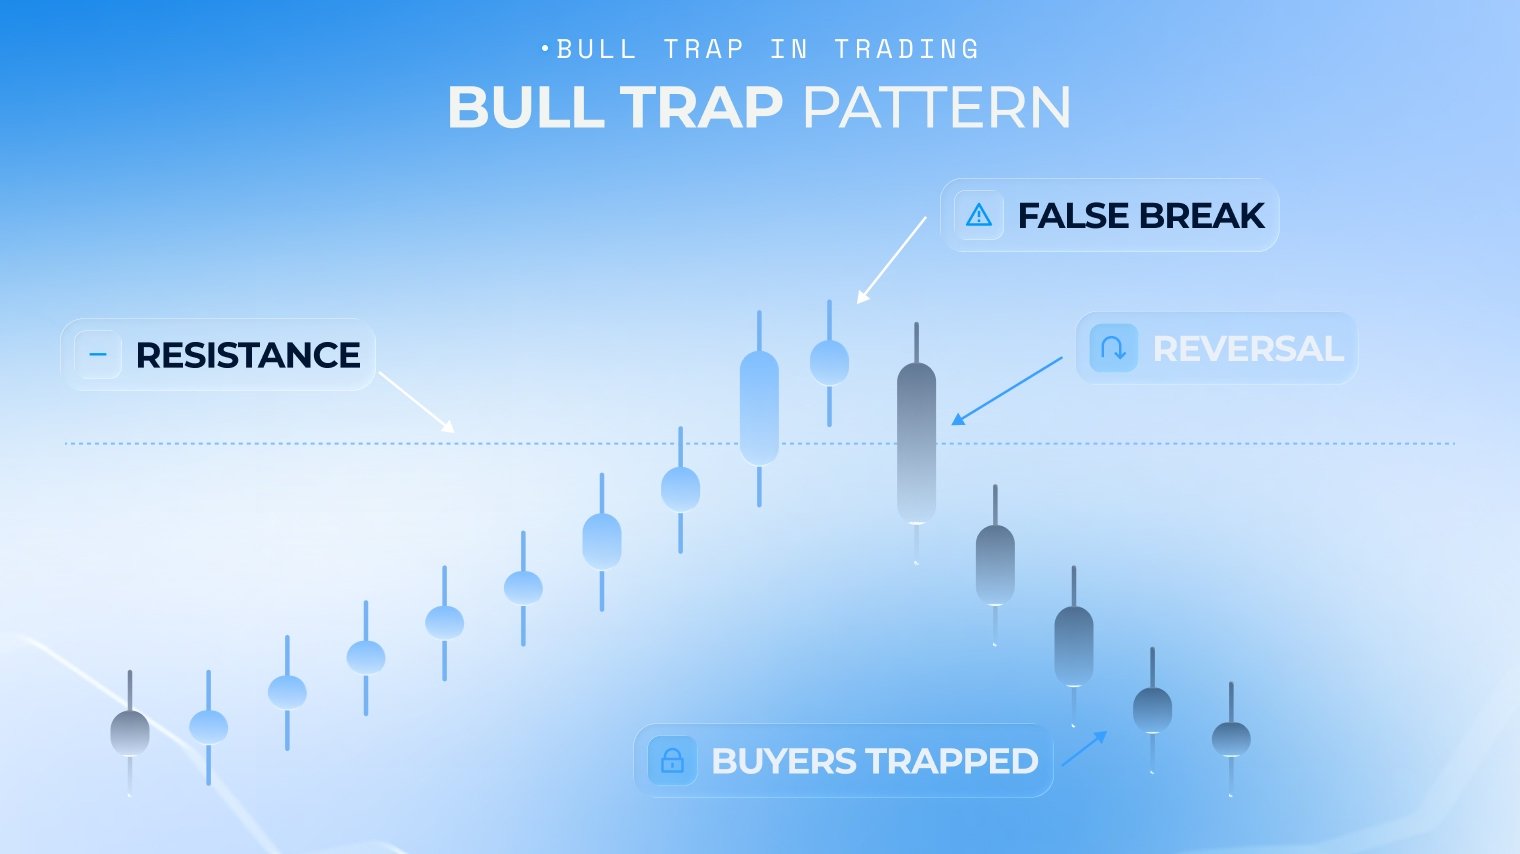
The mechanics behind the bull trap meaning are fairly mechanical once laid out. Price approaches a resistance level that has held before. Buyers push through it, and for a moment the breakout looks real, price trading above the old ceiling. Then follow-through never arrives. Instead of extending higher, price stalls, drifts, and eventually falls back below the level it just broke. The breakout itself, that first push above resistance, never actually confirmed anything. It only looked like confirmation. Watching that exact moment, where a real breakout and a fading one still look identical, is easier on a live chart than in any writeup, and the pocket option tutorial covers how to read those charts if the basics still feel shaky.
Signals That Need Confirmation
Confirmation exists to separate what is a bull trap really doing from what a single candle merely suggests at first glance. A candle that closes firmly above the level, rather than just poking through with a wick, is a start. Volume that expands on the breakout rather than staying flat is another. A retest of the broken level that holds, rather than sliding straight back through it, adds more. Price reaction and the broader market context matter just as much as any single technical signal. None of these, alone or combined, guarantee the breakout holds. They simply improve the odds compared to buying the instant a level breaks.
When the Move Looks Weak
A handful of signs tend to show up before the trap actually springs. A move that broke out on thin, unconvincing volume. A fast retreat back under the level inside a candle or two. Long upper wicks that show sellers stepping in hard right at the highs. No follow-through at all in the direction of the break. A sharp close back below resistance instead of holding above it. No single item on this list confirms anything by itself, but several appearing together tilt the odds in a meaningful way, true whether you are studying a bull trap vs bear trap setup or looking at just one side of it in isolation.
Bull Trap vs Bear Trap
Understanding what is a bull trap in trading gets clearer once you see its mirror image. One version catches buyers after a false move up. The other catches sellers after a false move down. Same underlying mechanism, opposite direction, same emotional trigger of chasing a move that looks real and is not.
Feature | Bull Trap | Bear Trap |
|---|---|---|
Direction | False breakout upward | False breakdown downward |
Who Gets Trapped | Buyers expecting continued upside | Sellers expecting continued downside |
Typical Reaction | Sharp reversal back below the level | Sharp reversal back above the level |
Key Risk | Buying into a reversal already underway | Shorting into a reversal already underway |
What the Pattern Can Look Like
There is no single template for what is a bull trap in stocks, or in any other market, but a common shape shows up often enough to be worth describing. Resistance breaks. Price pushes up for a candle or two, sometimes just a few percent, sometimes more. Continuation never arrives. Price rolls over and drifts back below the level it just cleared, often within the same session or the next one.
Picture a stock breaking above a well-watched resistance level on an ordinary morning, drifting up through the day on unremarkable volume, then closing back below that same resistance by the close. In real time, none of it looked dramatic or even particularly noteworthy, just another quiet session. Only with the benefit of hindsight, scrolling back through the chart afterward, does the shape of the trap actually stand out.
Real Breakout or Market Trap?
Telling a genuine breakout apart from either side of a bear trap vs bull trap situation rests on a short set of practical checks, not on gut feeling or how convincing the move felt in the moment. Does the level actually hold once price gets above or below it, rather than immediately failing? Does volume actually back the move, or does it dry up exactly when it should be building? Does a retest of the level hold rather than breaking straight back through? Does the candle actually close beyond the level, not just wick through it? None of these checks promise an accurate forecast. They simply separate a planned entry from a coin flip.
Where These Setups Appear
A bull trap pattern is not confined to one corner of the market. Stocks form them around earnings and technical levels. Forex pairs form them around session opens and major news. Crypto shows this behavior too, and usually faster and sharper than either one, since the volatility typical of that market can flip a convincing breakout into a full reversal in minutes instead of the hours or days it might take elsewhere.
Mistakes That Lead to Bad Entries
A short list of avoidable habits explains most cases of a bull trap stock setup catching someone off guard.
Buying the instant a level breaks, with zero confirmation of any kind.
Entering on emotion because the move feels urgent, rather than on an actual plan.
Ignoring volume entirely, or not checking it at all before entering.
Skipping a stop loss because the breakout felt too obvious to need one.
Chasing the entry after a candle has already made most of its move.
Trading directly against a strong overall trend or market context.
Trying to immediately win back a loss from a previous trap with a bigger, riskier position.
Risks Before Trading False Breakouts
A false breakout can reverse fast, often faster than there is time to react once the reversal is underway. High volatility around these setups can worsen execution, filling an exit at a noticeably worse price than planned. A stop loss can trigger sooner than expected if the reversal is sharp enough, especially on lower timeframes where a single strong candle covers a lot of ground. Leverage magnifies every one of these outcomes rather than softening any of them. And market traps are, by their nature, difficult to spot with full certainty in advance, which is exactly why they keep catching traders who were otherwise paying close attention.
Risk Disclaimer: Trading involves significant risk of capital loss. This article is for educational purposes only and does not constitute financial advice. Always conduct independent research and consider your risk tolerance before making any trading decisions.
See more:InterestingTrading Strategies